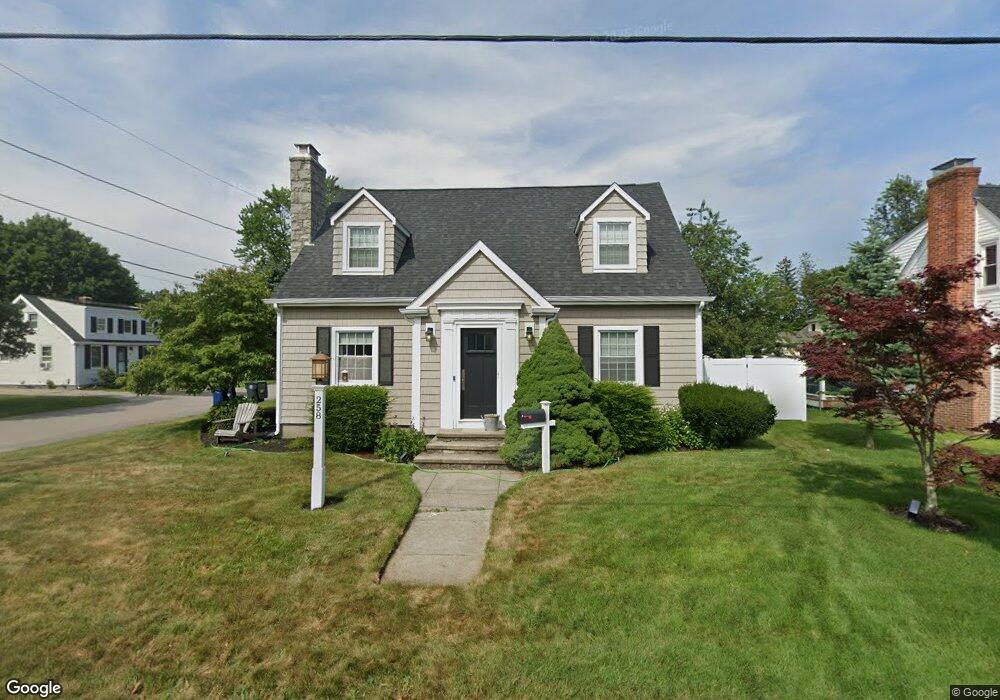
258 Pine St Warwick, RI 02888
Norwood NeighborhoodEstimated Value: $446,000 - $452,000
About This Home
This home is located at 258 Pine St, Warwick, RI 02888 and is currently estimated at $447,845, approximately $258 per square foot. 258 Pine St is a home located in Kent County with nearby schools including Nel/Cps Construction Career, St. Peter School, and Saint Paul School.
Ownership History
We collect this data history from publicly available records. To have your information removed, we recommend requesting removal directly through your county’s website.
Purchase Details
Home Financials for this Owner
Home Financials are based on the most recent Mortgage that was taken out on this home.Purchase Details
Home Values in the Area
Average Home Value in this Area
Purchase History
We collect this data history from publicly available records. To have your information removed, we recommend requesting removal directly through your county’s website.
| Date | Buyer | Sale Price | Title Company |
|---|---|---|---|
| $215,000 | -- | ||
| $271,000 | -- |
Mortgage History
We collect this data history from publicly available records. To have your information removed, we recommend requesting removal directly through your county’s website.
| Date | Status | Borrower | Loan Amount |
|---|---|---|---|
| Open | $218,075 | ||
| Closed | $214,853 | ||
| Closed | $211,678 | ||
| Previous Owner | $283,000 |
Tax History
We collect this data history from publicly available records. To have your information removed, we recommend requesting removal directly through your county’s website.
| Year | Tax Paid | Tax Assessment Tax Assessment Total Assessment is a certain percentage of the fair market value that is determined by local assessors to be the total taxable value of land and additions on the property. | Land | Improvement |
|---|---|---|---|---|
| 2025 | $4,936 | $388,700 | $101,100 | $287,600 |
| 2024 | $4,402 | $304,200 | $87,900 | $216,300 |
| 2023 | $4,317 | $304,200 | $87,900 | $216,300 |
| 2022 | $4,151 | $221,600 | $56,900 | $164,700 |
| 2021 | $4,151 | $221,600 | $56,900 | $164,700 |
| 2020 | $4,055 | $216,500 | $56,900 | $159,600 |
| 2019 | $4,055 | $216,500 | $56,900 | $159,600 |
| 2018 | $3,507 | $168,600 | $56,900 | $111,700 |
| 2017 | $3,412 | $168,600 | $56,900 | $111,700 |
| 2016 | $3,412 | $168,600 | $56,900 | $111,700 |
| 2015 | $3,100 | $149,400 | $55,800 | $93,600 |
| 2014 | $2,997 | $149,400 | $55,800 | $93,600 |
| 2013 | $2,933 | $148,200 | $55,800 | $92,400 |
Map
- 351 Maple St
- 427 Elm St
- 263 Maple St
- 68 Covel Cir
- 117 Sand Pond Rd
- 68 Maryland Ave
- 77 Majestic Ave
- 77 Kentucky Ave
- 26 Potomac Rd
- 205 Pawtuxet Ave
- 0 Elmwood Ave
- 130 Pilgrim Pkwy Unit 5
- 87 Easton Ave
- 15 Christopher Rhodes Way
- 110 Pilgrim Pkwy Unit 11
- 119 Cushing Rd
- 79 Bellevue Ave
- 56 Cottage St
- 78 Blackburn St
- 68 Zinnia Dr
Ask me questions while you tour the home.