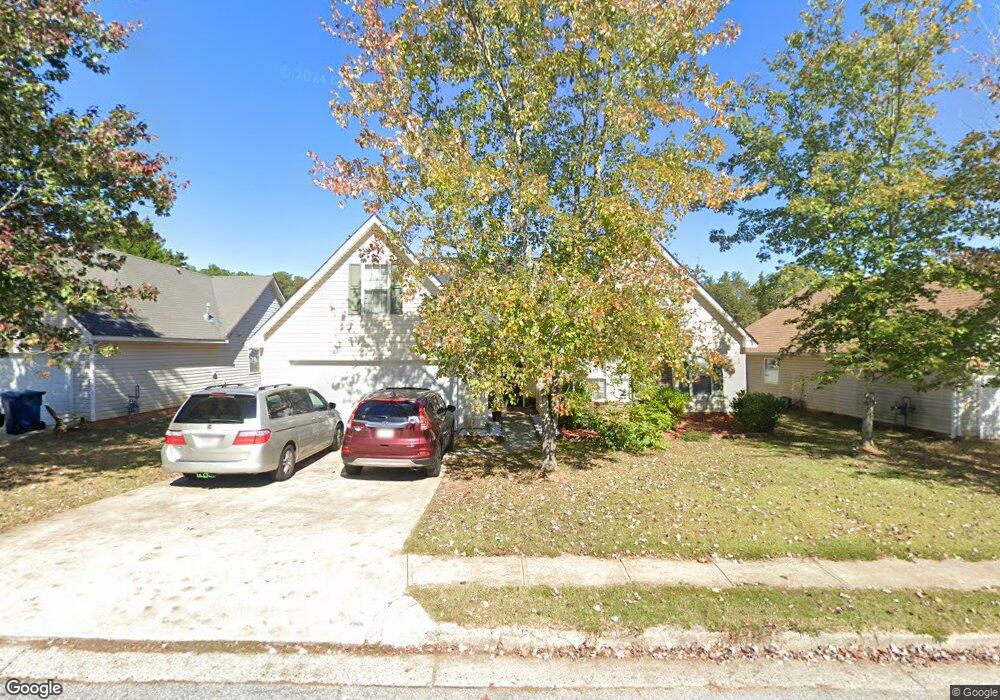
2580 Turtle Terrace Grayson, GA 30017
Estimated Value: $310,000 - $350,000
3
Beds
2
Baths
1,500
Sq Ft
$222/Sq Ft
Est. Value
About This Home
This home is located at 2580 Turtle Terrace, Grayson, GA 30017 and is currently estimated at $332,671, approximately $221 per square foot. 2580 Turtle Terrace is a home located in Gwinnett County with nearby schools including Grayson Elementary School, Bay Creek Middle School, and Grayson High School.
Ownership History
Date
Name
Owned For
Owner Type
Purchase Details
Closed on
Jul 19, 2018
Sold by
Ademovic Nurija
Bought by
Asante Francis and Adu Janet
Current Estimated Value
Home Financials for this Owner
Home Financials are based on the most recent Mortgage that was taken out on this home.
Original Mortgage
$177,721
Outstanding Balance
$154,644
Interest Rate
4.87%
Mortgage Type
FHA
Estimated Equity
$178,028
Purchase Details
Closed on
Nov 21, 2002
Sold by
Ademovic Nurija and Ademovic Sadeta
Bought by
Ademovic Nurija
Home Financials for this Owner
Home Financials are based on the most recent Mortgage that was taken out on this home.
Original Mortgage
$120,000
Interest Rate
6.1%
Mortgage Type
New Conventional
Purchase Details
Closed on
May 1, 2001
Sold by
Southern Creations Inc
Bought by
Ademovic Nurija and Ademovic Sedeta
Home Financials for this Owner
Home Financials are based on the most recent Mortgage that was taken out on this home.
Original Mortgage
$122,123
Interest Rate
6.9%
Mortgage Type
New Conventional
Create a Home Valuation Report for This Property
The Home Valuation Report is an in-depth analysis detailing your home's value as well as a comparison with similar homes in the area
Home Values in the Area
Average Home Value in this Area
Purchase History
We collect this data history from publicly available records. To have your information removed, we recommend requesting removal directly through your county’s website.
| Date | Buyer | Sale Price | Title Company |
|---|---|---|---|
| Asante Francis | $181,000 | -- | |
| Ademovic Nurija | -- | -- | |
| Ademovic Nurija | $125,900 | -- |
Source: Public Records
Mortgage History
We collect this data history from publicly available records. To have your information removed, we recommend requesting removal directly through your county’s website.
| Date | Status | Borrower | Loan Amount |
|---|---|---|---|
| Open | Asante Francis | $177,721 | |
| Previous Owner | Ademovic Nurija | $120,000 | |
| Previous Owner | Ademovic Nurija | $122,123 |
Source: Public Records
Tax History
| Year | Tax Paid | Tax Assessment Tax Assessment Total Assessment is a certain percentage of the fair market value that is determined by local assessors to be the total taxable value of land and additions on the property. | Land | Improvement |
|---|---|---|---|---|
| 2025 | $4,900 | $128,840 | $26,120 | $102,720 |
| 2024 | $4,629 | $119,640 | $26,120 | $93,520 |
| 2023 | $4,629 | $121,080 | $27,200 | $93,880 |
| 2022 | $4,154 | $107,400 | $20,800 | $86,600 |
| 2021 | $2,924 | $71,800 | $14,800 | $57,000 |
| 2020 | $2,939 | $71,800 | $14,800 | $57,000 |
| 2019 | $2,833 | $71,800 | $14,800 | $57,000 |
| 2018 | $2,398 | $59,400 | $12,800 | $46,600 |
| 2016 | $2,173 | $52,480 | $10,760 | $41,720 |
| 2015 | $2,195 | $52,480 | $10,760 | $41,720 |
| 2014 | $2,125 | $50,200 | $9,600 | $40,600 |
Source: Public Records
Map
Nearby Homes
- 2505 Sea Turtle Ln
- 2250 Ridge Forest Dr
- 475 Brown Dove Ln
- 1770 Gleneden Ct
- 2520 Potomac View Ct
- 2531 Falcon Ridge Dr
- 2523 Haynes Meadow Ct
- 2255 Pinehaven Ct
- #2 Tuftstown Ct
- #1 Tuftstown Ct
- 2542 Haynes Meadow Ct
- 1230 Skipping Rock Ln
- 2935 Haynes Club Cir Unit 2
- 1800 Tuftstown Ct Unit 1
- 2691 Falcon Ridge Dr
- 2662 Whispering Pines Dr
- 2531 Farmstead Ct
- 2538 Three Bars Dr
- 1833 Easter Cody Ct
- 2333 Laurelfield Dr
- 2500 Sea Turtle Ln
- 2525 Sea Turtle Ln
- 2550 Turtle Terrace
- 2560 Turtle Terrace
- 2540 Turtle Terrace Unit 26
- 2540 Turtle Terrace
- 2490 Turtle Terrace
- 2510 Sea Turtle Ln
- 2535 Sea Turtle Ln
- 2590 Turtle Terrace
- 2520 Sea Turtle Ln
- 2500 Turtle Terrace
- 2555 Sea Turtle Ln
- 2530 Sea Turtle Ln
- 2600 Turtle Terrace
- 2565 Turtle Terrace
- 2540 Sea Turtle Ln
- 2555 Turtle Terrace
- 2575 Turtle Terrace
- 2545 Turtle Terrace
Your Personal Tour Guide
Ask me questions while you tour the home.