
Landlord's Agent in 2025
Kashif Rasul
Samson Properties
(703) 380-1091
5 in this area
66 Total Sales


Estimated Value: $1,004,000 - $1,098,382
***** Available from July 1st, 2025****
Spacious Brick Front 5-Bedroom Home in Highly Desired South Riding!
****Deck is conveyed as is. Landlord takes no responsibility of tenants using the deck during the term of the lease.
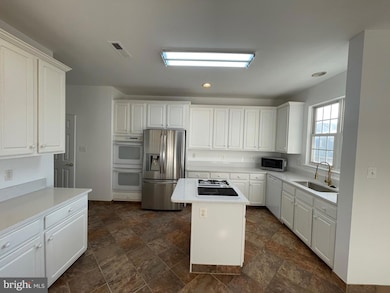
Welcome to this beautifully updated and spacious 5-bedroom, 4.5-bath single-family home located in the heart of South Riding, one of Loudoun County’s most sought-after communities. Boasting over 4,500 square feet of finished living space and situated on a .31-acre lot, this home offers comfort, style, and convenience for modern living.
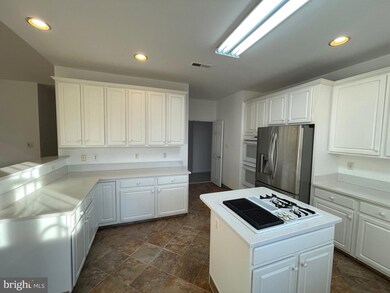
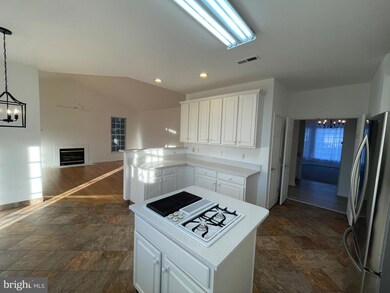
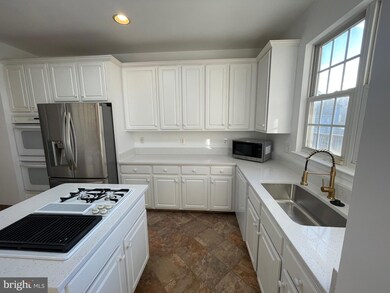
Built in 2000, this stately home features an impressive double-story foyer, LVP flooring, neutral paint, and a light-filled open floor plan. The gourmet kitchen is a chef’s dream with white cabinets, quartz countertops, stainless steel appliances, gas cooking, and a sunroom/bonus room just off the kitchen—perfect for casual dining or relaxing.
Enjoy the flexibility of an entry-level master bedroom with high ceilings and has a walk-in closet, master bath with soaking tub, shower & double vanity. The upper-level features 3 generously sized secondary bedrooms & 2 bathrooms. The fully finished walk-out basement includes a big rec room, an additional large bedroom and a full bath, perfect for multigenerational living or an in-law suite.
The asphalt driveway and 2-car garage offer ample parking and storage space.
Enjoy all the amenities South Riding has to offer, including:
Basketball & volleyball courts
Multiple swimming pools
Soccer field & tennis courts
Dog park
Bike trails
Exercise room & community center
Clubhouse, picnic areas, & tot lots
Located minutes from Route 50, Loudoun County Parkway, Dulles Toll Road, retail, restaurants, Walmart, and more, this home combines a peaceful suburban setting with unbeatable access to shopping, commuting routes, and entertainment.
This is the perfect place to call home—don’t miss it!
Last Agent to Rent the Property
(703) 378-8810 donnysamson@samsonproperties.net Samson Properties License #0225204830 Listed on: 05/15/2025
Last Renter's Agent
(703) 378-8810 donnysamson@samsonproperties.net Samson Properties License #0225250957
We collect this data history from publicly available records. To have your information removed, we recommend requesting removal directly through your county’s website.
| Date | Buyer | Sale Price | Title Company |
|---|---|---|---|
| San Kaung | $845,000 | -- |
We collect this data history from publicly available records. To have your information removed, we recommend requesting removal directly through your county’s website.
| Date | Status | Borrower | Loan Amount |
|---|---|---|---|
| Open | San Kaung | $647,200 |
| Date | Event | Price | List to Sale | Price per Sq Ft | Prior Sale |
|---|---|---|---|---|---|
| 08/17/2025 08/17/25 | Rented | $4,400 | -4.3% | -- | |
| 07/28/2025 07/28/25 | Price Changed | $4,600 | -4.2% | $1 / Sq Ft | |
| 07/18/2025 07/18/25 | Price Changed | $4,800 | -4.0% | $1 / Sq Ft | |
| 05/19/2025 05/19/25 | For Rent | $5,000 | +25.0% | -- | |
| 10/22/2023 10/22/23 | Rented | $3,999 | 0.0% | -- | |
| 08/16/2023 08/16/23 | Price Changed | $3,999 | -7.0% | $1 / Sq Ft | |
| 08/10/2023 08/10/23 | Price Changed | $4,300 | -4.4% | $1 / Sq Ft | |
| 07/26/2023 07/26/23 | For Rent | $4,500 | 0.0% | -- | |
| 07/19/2023 07/19/23 | Off Market | $4,500 | -- | -- | |
| 07/17/2023 07/17/23 | For Rent | $4,500 | +36.4% | -- | |
| 02/24/2023 02/24/23 | Rented | $3,300 | 0.0% | -- | |
| 02/23/2023 02/23/23 | Under Contract | -- | -- | -- | |
| 01/03/2023 01/03/23 | Price Changed | $3,300 | -5.7% | $1 / Sq Ft | |
| 12/15/2022 12/15/22 | Price Changed | $3,500 | -7.9% | $1 / Sq Ft | |
| 12/05/2022 12/05/22 | For Rent | $3,800 | 0.0% | -- | |
| 08/26/2022 08/26/22 | Sold | $845,000 | -5.6% | $192 / Sq Ft | View Prior Sale |
| 07/30/2022 07/30/22 | Pending | -- | -- | -- | |
| 07/18/2022 07/18/22 | Price Changed | $895,000 | -3.8% | $204 / Sq Ft | |
| 07/15/2022 07/15/22 | For Sale | $929,900 | -- | $212 / Sq Ft |
| Year | Tax Paid | Tax Assessment Tax Assessment Total Assessment is a certain percentage of the fair market value that is determined by local assessors to be the total taxable value of land and additions on the property. | Land | Improvement |
|---|---|---|---|---|
| 2025 | $8,333 | $1,035,170 | $301,800 | $733,370 |
| 2024 | $8,608 | $995,100 | $301,800 | $693,300 |
| 2023 | $7,835 | $895,480 | $276,800 | $618,680 |
| 2022 | $7,486 | $841,120 | $246,800 | $594,320 |
| 2021 | $7,179 | $732,590 | $216,800 | $515,790 |
| 2020 | $7,086 | $684,660 | $201,800 | $482,860 |
| 2019 | $7,060 | $675,640 | $201,800 | $473,840 |
| 2018 | $7,194 | $663,010 | $181,800 | $481,210 |
| 2017 | $6,891 | $612,520 | $181,800 | $430,720 |
| 2016 | $7,073 | $617,710 | $0 | $0 |
| 2015 | $7,339 | $464,850 | $0 | $464,850 |
| 2014 | $7,389 | $457,980 | $0 | $457,980 |
Landlord's Agent in 2025
Kashif Rasul
Samson Properties
(703) 380-1091
5 in this area
66 Total Sales
Tenant's Agent in 2025
Pratibha Hublikar
Samson Properties
(202) 506-3674
1 in this area
27 Total Sales
Buyer's Agent in 2023
Karen Olmstead
Coldwell Banker (NRT-Southeast-MidAtlantic)
(703) 598-1040
1 in this area
69 Total Sales
A
Buyer's Agent in 2023
Ayse Ozbilge
Keller Williams Realty
(703) 508-3723
7 Total Sales
Seller's Agent in 2022
Amy Summersgill
EXP Realty, LLC
(571) 233-5650
5 in this area
27 Total Sales
Buyer's Agent in 2022
Paul Thistle
Take 2 Real Estate LLC
(703) 626-5607
6 in this area
404 Total Sales
Source: Bright MLS
MLS Number: VALO2096350
APN: 129-10-9393
Disclaimer: Certain information contained herein is derived from information provided by parties other than Homes.com. All information provided is deemed reliable, but is not guaranteed to be accurate and should be independently verified.
![]() The data relating to real estate for sale on this website appears in part through the BRIGHT Internet Data Exchange program, a voluntary cooperative exchange of property listing data between licensed real estate brokerage firms, and is provided by BRIGHT through a licensing agreement.
The data relating to real estate for sale on this website appears in part through the BRIGHT Internet Data Exchange program, a voluntary cooperative exchange of property listing data between licensed real estate brokerage firms, and is provided by BRIGHT through a licensing agreement.
Listing information is from various brokers who participate in the Bright MLS IDX program and not all listings may be visible on the site.
The property information being provided on or through the website is for the personal, non-commercial use of consumers and such information may not be used for any purpose other than to identify prospective properties consumers may be interested in purchasing.
Some properties which appear for sale on the website may no longer be available because they are for instance, under contract, sold or are no longer being offered for sale.
Property information displayed is deemed reliable but is not guaranteed.
Copyright 2026 Bright MLS, Inc.
Ask me questions while you tour the home.