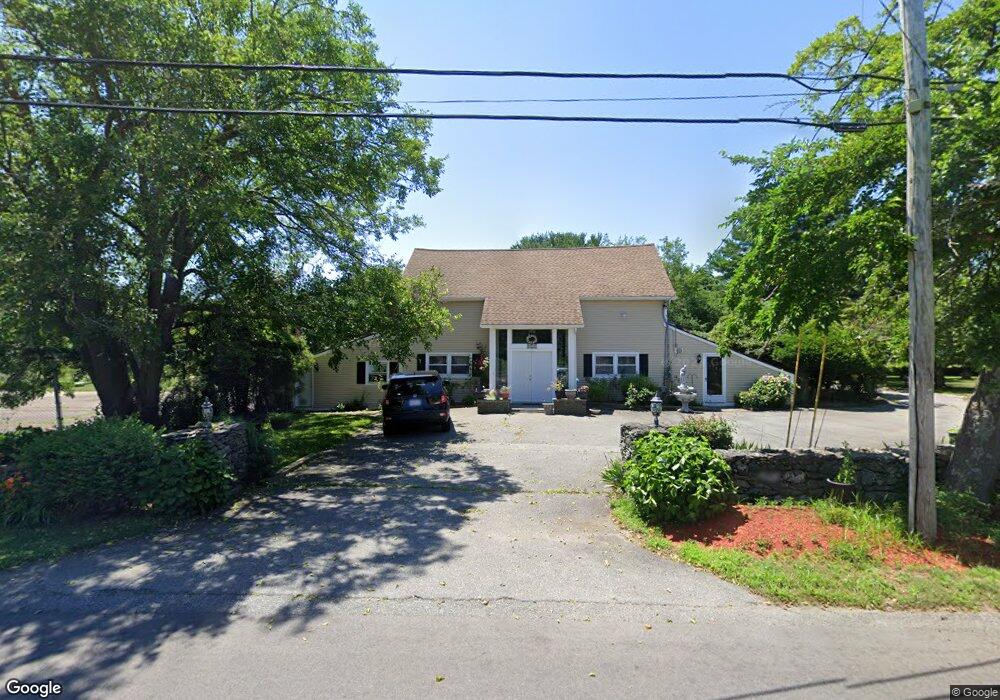
259 Cedar Ave Swansea, MA 02777
Luther Corner NeighborhoodEstimated Value: $776,000 - $1,531,000
About This Home
This home is located at 259 Cedar Ave, Swansea, MA 02777 and is currently estimated at $1,053,416, approximately $212 per square foot. 259 Cedar Ave is a home located in Bristol County with nearby schools including Joseph Case High School and Swansea Wood School.
Ownership History
We collect this data history from publicly available records. To have your information removed, we recommend requesting removal directly through your county’s website.
Purchase Details
Purchase Details
Home Values in the Area
Average Home Value in this Area
Purchase History
We collect this data history from publicly available records. To have your information removed, we recommend requesting removal directly through your county’s website.
| Date | Buyer | Sale Price | Title Company |
|---|---|---|---|
| -- | -- | ||
| -- | -- |
Mortgage History
We collect this data history from publicly available records. To have your information removed, we recommend requesting removal directly through your county’s website.
| Date | Status | Borrower | Loan Amount |
|---|---|---|---|
| Previous Owner | $250,000 | ||
| Previous Owner | $184,000 | ||
| Previous Owner | $133,000 | ||
| Previous Owner | $40,000 |
Tax History
We collect this data history from publicly available records. To have your information removed, we recommend requesting removal directly through your county’s website.
| Year | Tax Paid | Tax Assessment Tax Assessment Total Assessment is a certain percentage of the fair market value that is determined by local assessors to be the total taxable value of land and additions on the property. | Land | Improvement |
|---|---|---|---|---|
| 2025 | $8,654 | $726,000 | $243,000 | $483,000 |
| 2024 | $8,921 | $744,000 | $243,000 | $501,000 |
| 2023 | $9,093 | $692,500 | $187,400 | $505,100 |
| 2022 | $8,123 | $564,500 | $168,100 | $396,400 |
| 2021 | $8,239 | $527,100 | $173,900 | $353,200 |
| 2020 | $8,070 | $518,000 | $179,800 | $338,200 |
| 2019 | $7,888 | $508,600 | $160,500 | $348,100 |
| 2018 | $7,473 | $489,100 | $157,500 | $331,600 |
| 2017 | $6,515 | $490,600 | $152,400 | $338,200 |
| 2016 | $5,757 | $425,800 | $148,200 | $277,600 |
| 2015 | $5,546 | $422,400 | $148,200 | $274,200 |
| 2014 | $5,424 | $422,400 | $148,200 | $274,200 |
Map
- 475 Cedar Ave
- 10 Knights Way Unit 10
- 4 Clark Ln
- 23 Pine St
- 517 Pearse Rd
- 73 Regent Ct
- 126 Ocean View Ave
- 78 Munsey Ave
- 48 Hummingbird Ln
- 16 Clancy St
- 86 Ocean View Ave
- 28 Brown St
- 0 Brown St
- 202-204 Pinehurst Ave
- 821 Pearse Rd
- 193 Linden St
- 441 Ocean Grove Ave
- 58 Pond St
- 56 Burnside Dr
- 32 Mohill Ave
Ask me questions while you tour the home.