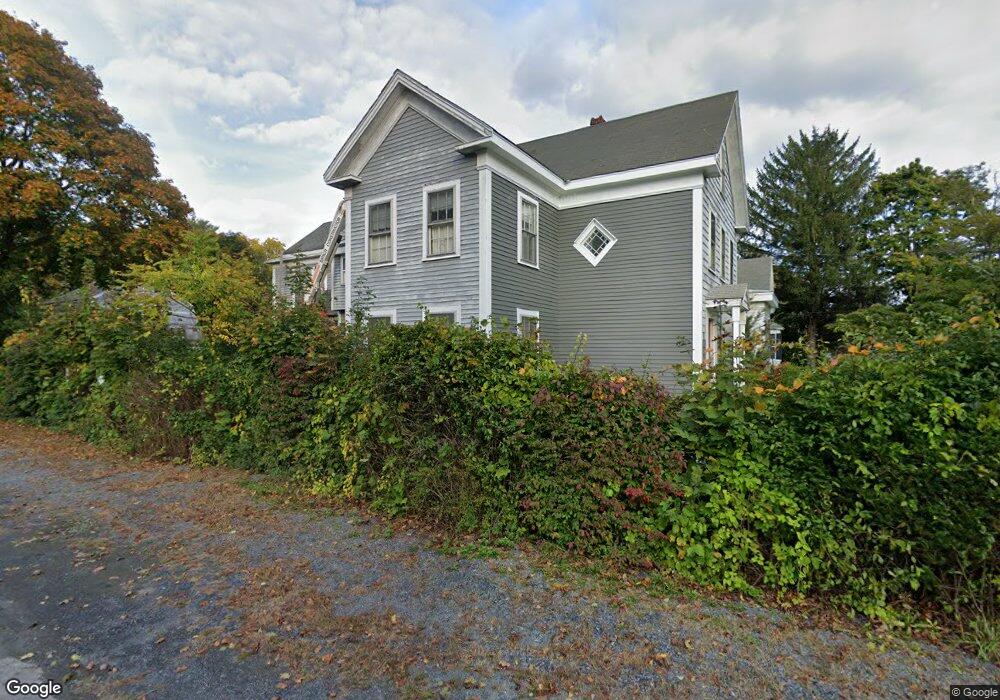
259 Main St Kingston, MA 02364
Estimated Value: $645,079 - $818,000
5
Beds
2
Baths
3,273
Sq Ft
$229/Sq Ft
Est. Value
About This Home
This home is located at 259 Main St, Kingston, MA 02364 and is currently estimated at $749,020, approximately $228 per square foot. 259 Main St is a home located in Plymouth County with nearby schools including Kingston Elementary School, Silver Lake Regional High School, and Kingston Intermediate School.
Ownership History
Date
Name
Owned For
Owner Type
Purchase Details
Closed on
Sep 1, 1980
Bought by
Matinzi David
Current Estimated Value
Create a Home Valuation Report for This Property
The Home Valuation Report is an in-depth analysis detailing your home's value as well as a comparison with similar homes in the area
Home Values in the Area
Average Home Value in this Area
Purchase History
We collect this data history from publicly available records. To have your information removed, we recommend requesting removal directly through your county’s website.
| Date | Buyer | Sale Price | Title Company |
|---|---|---|---|
| Matinzi David | -- | -- |
Source: Public Records
Mortgage History
We collect this data history from publicly available records. To have your information removed, we recommend requesting removal directly through your county’s website.
| Date | Status | Borrower | Loan Amount |
|---|---|---|---|
| Closed | Matinzi David | $36,000 |
Source: Public Records
Tax History
| Year | Tax Paid | Tax Assessment Tax Assessment Total Assessment is a certain percentage of the fair market value that is determined by local assessors to be the total taxable value of land and additions on the property. | Land | Improvement |
|---|---|---|---|---|
| 2025 | $7,473 | $576,200 | $216,400 | $359,800 |
| 2024 | $6,574 | $517,200 | $216,400 | $300,800 |
| 2023 | $7,017 | $525,200 | $216,400 | $308,800 |
| 2022 | $7,105 | $487,300 | $191,900 | $295,400 |
| 2021 | $72 | $474,700 | $191,900 | $282,800 |
| 2020 | $73 | $442,800 | $191,900 | $250,900 |
| 2019 | $62 | $405,600 | $191,900 | $213,700 |
| 2018 | $5,589 | $392,300 | $191,900 | $200,400 |
| 2017 | $5,768 | $349,600 | $172,900 | $176,700 |
| 2016 | $5,202 | $295,400 | $163,400 | $132,000 |
| 2015 | $5,004 | $295,400 | $163,400 | $132,000 |
| 2014 | $4,987 | $299,000 | $158,000 | $141,000 |
Source: Public Records
Map
Nearby Homes
- 228 Main St
- 10 Wapping Rd
- 11 Center St
- 68 Elm St Unit 68
- Lot 17-1 Howland's Ln
- 123 Summer St
- 38 Landing Rd
- 40 Landing Rd
- 64 Wapping Rd
- 19 Lodgepole Ln
- 46 Foxworth Ln
- 735 Bay Rd
- 26 Bay Farm Rd
- 71 Fountain Knoll Ln
- 58 Bay Farm Rd
- 70 Indian Pond Rd
- 76 Woodridge Rd
- 36 Mayflower St
- 54 Bay Farm Rd
- 110 Main St
Your Personal Tour Guide
Ask me questions while you tour the home.