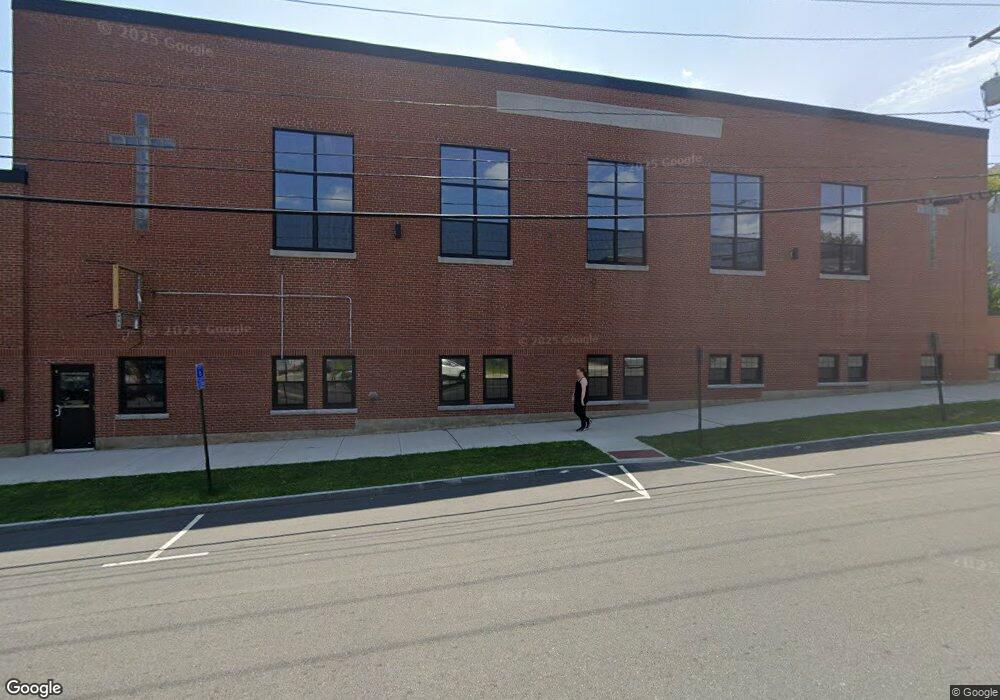
26 Broadway Haverhill, MA 01832
Mount Washington NeighborhoodEstimated Value: $1,922,166
Studio
20
Baths
7,772
Sq Ft
$247/Sq Ft
Est. Value
About This Home
This home is located at 26 Broadway, Haverhill, MA 01832 and is currently priced at $1,922,166, approximately $247 per square foot. 26 Broadway is a home located in Essex County with nearby schools including Tilton Elementary School, Consentino Middle School, and Haverhill High School.
Ownership History
Date
Name
Owned For
Owner Type
Purchase Details
Closed on
Sep 8, 2020
Sold by
Roman Cath Archb Of Bosto
Bought by
Saint Josephs Schoolhouse
Current Estimated Value
Home Financials for this Owner
Home Financials are based on the most recent Mortgage that was taken out on this home.
Original Mortgage
$999,999
Outstanding Balance
$881,698
Interest Rate
2.8%
Mortgage Type
Purchase Money Mortgage
Create a Home Valuation Report for This Property
The Home Valuation Report is an in-depth analysis detailing your home's value as well as a comparison with similar homes in the area
Home Values in the Area
Average Home Value in this Area
Purchase History
We collect this data history from publicly available records. To have your information removed, we recommend requesting removal directly through your county’s website.
| Date | Buyer | Sale Price | Title Company |
|---|---|---|---|
| Saint Josephs Schoolhouse | $1,500,000 | None Available | |
| Schoolhouse Saint Josephs | $1,500,000 | None Available |
Source: Public Records
Mortgage History
We collect this data history from publicly available records. To have your information removed, we recommend requesting removal directly through your county’s website.
| Date | Status | Borrower | Loan Amount |
|---|---|---|---|
| Open | Schoolhouse Saint Josephs | $999,999 | |
| Closed | Saint Josephs Schoolhouse | $999,999 |
Source: Public Records
Tax History
| Year | Tax Paid | Tax Assessment Tax Assessment Total Assessment is a certain percentage of the fair market value that is determined by local assessors to be the total taxable value of land and additions on the property. | Land | Improvement |
|---|---|---|---|---|
| 2025 | -- | $6,338,465 | $2,442,000 | $3,896,465 |
| 2024 | -- | $4,887,375 | $1,944,000 | $2,943,375 |
| 2023 | $0 | $3,999,400 | $1,944,000 | $2,055,400 |
| 2022 | $0 | $2,417,000 | $1,692,000 | $725,000 |
| 2021 | $0 | $2,304,600 | $510,500 | $1,794,100 |
| 2020 | $0 | $2,288,100 | $494,000 | $1,794,100 |
| 2019 | $0 | $2,288,100 | $494,000 | $1,794,100 |
| 2018 | $0 | $2,168,100 | $494,000 | $1,674,100 |
| 2017 | $0 | $2,075,500 | $401,400 | $1,674,100 |
| 2016 | -- | $2,075,500 | $401,400 | $1,674,100 |
| 2015 | -- | $2,075,500 | $401,400 | $1,674,100 |
Source: Public Records
Map
Nearby Homes
- 22 Hilldale Ave
- 97-99 Blaisdell St Unit 1
- 116 Blaisdell St
- 61 Hilldale Ave
- 71 Hilldale Ave
- 25 High St
- 41-43 Arch St
- 29 Lewis St
- 108 Harrison St
- 131 Pilling St
- 69 Harrison St
- 150 Hale St
- 6 Kimball St
- 37 Warrenton Rd
- 31 Orchard St Unit A
- 301 Washington St
- 2 Avon Place
- 192 Franklin St
- 32 1/2 Nichols St
- 7 Overlook Ave
- 26 Broadway Unit 303
- 26 Broadway Unit 308
- 28 Broadway Unit 4
- 28 Broadway Unit 3
- 28 Broadway Unit 2
- 28 Broadway Unit 1
- 36 Broadway Unit 2
- 36 Broadway Unit 1
- 107 Bellevue Ave
- 109 Bellevue Ave
- 27 Broadway
- 111 Bellevue Ave
- 105 Bellevue Ave Unit 2
- 105 Bellevue Ave Unit 1
- 105 Bellevue Ave Unit 3
- 105 Bellevue Ave
- 21 Broadway
- 21 Broadway Unit 1
- 21 Broadway Unit 3
- 103 Bellevue Ave
Your Personal Tour Guide
Ask me questions while you tour the home.