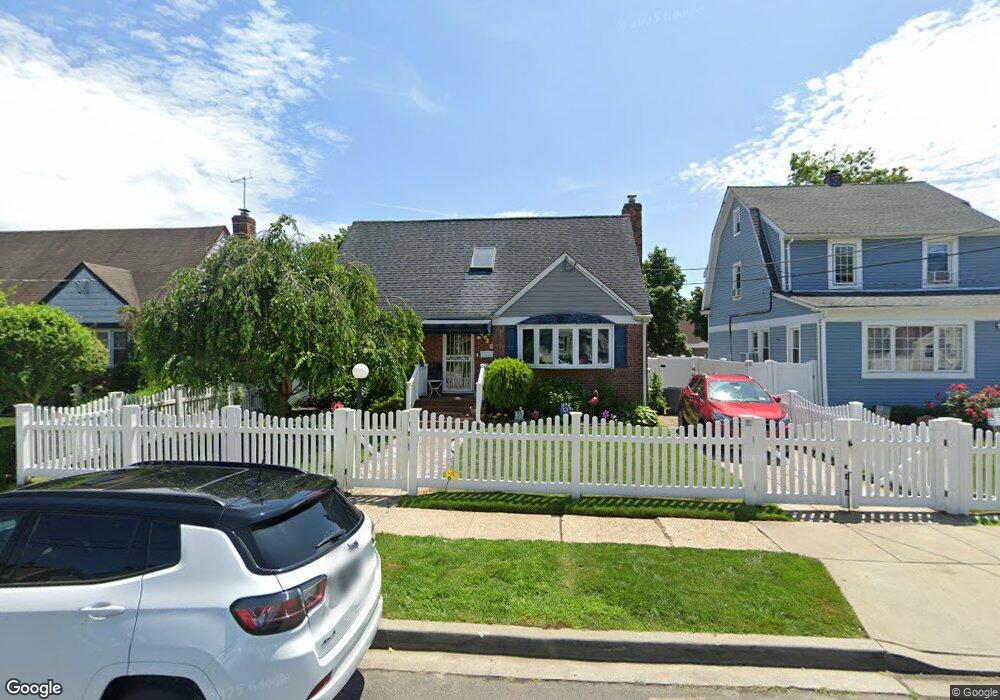
26 Chase St Hempstead, NY 11550
Estimated Value: $596,189 - $642,000
Studio
1
Bath
1,142
Sq Ft
$542/Sq Ft
Est. Value
About This Home
This home is located at 26 Chase St, Hempstead, NY 11550 and is currently estimated at $619,095, approximately $542 per square foot. 26 Chase St is a home located in Nassau County with nearby schools including Evergreen Charter School and Crescent School.
Ownership History
Date
Name
Owned For
Owner Type
Purchase Details
Closed on
Dec 4, 2009
Sold by
Blue Rive Realty Corp
Bought by
Quinones Alma L and Jimenez Carlos
Current Estimated Value
Home Financials for this Owner
Home Financials are based on the most recent Mortgage that was taken out on this home.
Original Mortgage
$272,669
Outstanding Balance
$176,108
Interest Rate
4.71%
Mortgage Type
FHA
Estimated Equity
$442,987
Purchase Details
Closed on
Nov 17, 2000
Sold by
Executrix-Pinkney Leslie Ann
Bought by
Shands Wesley
Create a Home Valuation Report for This Property
The Home Valuation Report is an in-depth analysis detailing your home's value as well as a comparison with similar homes in the area
Home Values in the Area
Average Home Value in this Area
Purchase History
We collect this data history from publicly available records. To have your information removed, we recommend requesting removal directly through your county’s website.
| Date | Buyer | Sale Price | Title Company |
|---|---|---|---|
| Quinones Alma L | $277,700 | -- | |
| Shands Wesley | $82,000 | Joan, Esq. Shands |
Source: Public Records
Mortgage History
We collect this data history from publicly available records. To have your information removed, we recommend requesting removal directly through your county’s website.
| Date | Status | Borrower | Loan Amount |
|---|---|---|---|
| Open | Quinones Alma L | $272,669 |
Source: Public Records
Tax History
| Year | Tax Paid | Tax Assessment Tax Assessment Total Assessment is a certain percentage of the fair market value that is determined by local assessors to be the total taxable value of land and additions on the property. | Land | Improvement |
|---|---|---|---|---|
| 2025 | $7,089 | $324 | $130 | $194 |
| 2024 | $885 | $324 | $130 | $194 |
| 2023 | $7,387 | $324 | $130 | $194 |
| 2022 | $7,387 | $324 | $130 | $194 |
| 2021 | $11,635 | $314 | $126 | $188 |
| 2020 | $8,998 | $649 | $422 | $227 |
| 2019 | $9,445 | $649 | $422 | $227 |
| 2018 | $9,020 | $649 | $0 | $0 |
| 2017 | $7,034 | $649 | $422 | $227 |
| 2016 | $8,170 | $649 | $422 | $227 |
| 2015 | $1,087 | $649 | $422 | $227 |
| 2014 | $1,087 | $649 | $422 | $227 |
| 2013 | $1,006 | $649 | $422 | $227 |
Source: Public Records
Map
Nearby Homes
Your Personal Tour Guide
Ask me questions while you tour the home.