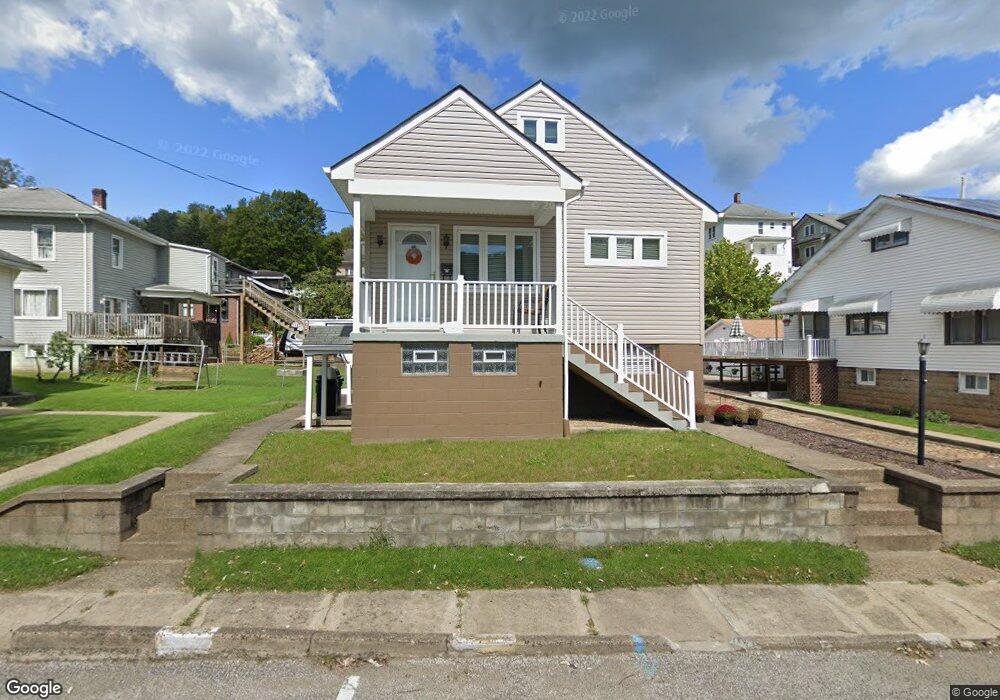
26 Chestnut St Bridgeport, OH 43912
Estimated Value: $107,794 - $172,000
4
Beds
2
Baths
1,720
Sq Ft
$78/Sq Ft
Est. Value
About This Home
This home is located at 26 Chestnut St, Bridgeport, OH 43912 and is currently estimated at $134,949, approximately $78 per square foot. 26 Chestnut St is a home located in Belmont County with nearby schools including Bridgeport Elementary School, Bridgeport Middle School, and Bridgeport High School.
Ownership History
Date
Name
Owned For
Owner Type
Purchase Details
Closed on
Jul 1, 2010
Sold by
Ritner Harry M and Ritner Janice F
Bought by
Murray Donald J and Timko Amanda M
Current Estimated Value
Home Financials for this Owner
Home Financials are based on the most recent Mortgage that was taken out on this home.
Original Mortgage
$89,775
Outstanding Balance
$61,026
Interest Rate
5.5%
Mortgage Type
FHA
Estimated Equity
$73,923
Purchase Details
Closed on
Jan 7, 2005
Sold by
Elekes Elmer and Elekes Agnes T
Bought by
Ritner Harry M and Ritner Janice F
Purchase Details
Closed on
Sep 26, 2001
Sold by
Elekes Agnes T
Bought by
Elekes Agnes T
Purchase Details
Closed on
Jan 1, 1986
Sold by
Suto Mary A
Bought by
Suto Mary A
Create a Home Valuation Report for This Property
The Home Valuation Report is an in-depth analysis detailing your home's value as well as a comparison with similar homes in the area
Purchase History
We collect this data history from publicly available records. To have your information removed, we recommend requesting removal directly through your county’s website.
| Date | Buyer | Sale Price | Title Company |
|---|---|---|---|
| Murray Donald J | $91,000 | Attorney | |
| Ritner Harry M | $54,750 | None Available | |
| Elekes Agnes T | -- | -- | |
| Suto Mary A | -- | -- |
Source: Public Records
Mortgage History
We collect this data history from publicly available records. To have your information removed, we recommend requesting removal directly through your county’s website.
| Date | Status | Borrower | Loan Amount |
|---|---|---|---|
| Open | Murray Donald J | $89,775 |
Source: Public Records
Tax History
| Year | Tax Paid | Tax Assessment Tax Assessment Total Assessment is a certain percentage of the fair market value that is determined by local assessors to be the total taxable value of land and additions on the property. | Land | Improvement |
|---|---|---|---|---|
| 2025 | $1,212 | $32,210 | $2,510 | $29,700 |
| 2024 | $1,190 | $32,210 | $2,510 | $29,700 |
| 2023 | $1,281 | $31,310 | $2,500 | $28,810 |
| 2022 | $1,280 | $31,307 | $2,502 | $28,805 |
| 2021 | $1,299 | $31,307 | $2,502 | $28,805 |
| 2020 | $1,126 | $27,230 | $2,180 | $25,050 |
| 2019 | $1,127 | $27,230 | $2,180 | $25,050 |
| 2018 | $1,153 | $27,230 | $2,180 | $25,050 |
| 2017 | $1,162 | $25,470 | $2,640 | $22,830 |
| 2016 | $1,141 | $25,470 | $2,640 | $22,830 |
| 2015 | $1,137 | $25,470 | $2,640 | $22,830 |
| 2014 | $1,155 | $25,230 | $2,400 | $22,830 |
| 2013 | $1,101 | $25,230 | $2,400 | $22,830 |
Source: Public Records
Map
Nearby Homes
- 4 Walnut Ave
- 13 Prospect St
- 12 Cross St
- 56316 National Rd
- 836 Main St
- 56624 Boyd Ave
- 44 Mann St
- 1049 Buckeye St
- 67480 Plum St
- 806 Howard St
- 822 W Bennett St
- 67457 Kirkwood Heights Rd
- 609 Whitely St
- 67478 Kirkwood Heights Rd
- 55935 Main St
- 422 Whitely St
- 413 Bennett St
- TBD Alexander Rd
- 308 Whitely St
- 69142 Woods Rd
- 24 Chestnut St
- 4 Brookside Ave
- 6 Brookside Ave
- 25 Chestnut St
- 22 Chestnut St
- 8 Brookside Ave
- 20 Chestnut St
- 11 Poplar St
- 10 Brookside Ave
- 18 Chestnut St
- 902 National Rd
- 7 Poplar St
- 16 Chestnut St
- 5 Brookside Ave
- 900 National Rd
- 5 Poplar St
- 898 National Rd
- 14 Chestnut St
- 7 Brookside Ave
- 12 Chestnut St
Your Personal Tour Guide
Ask me questions while you tour the home.