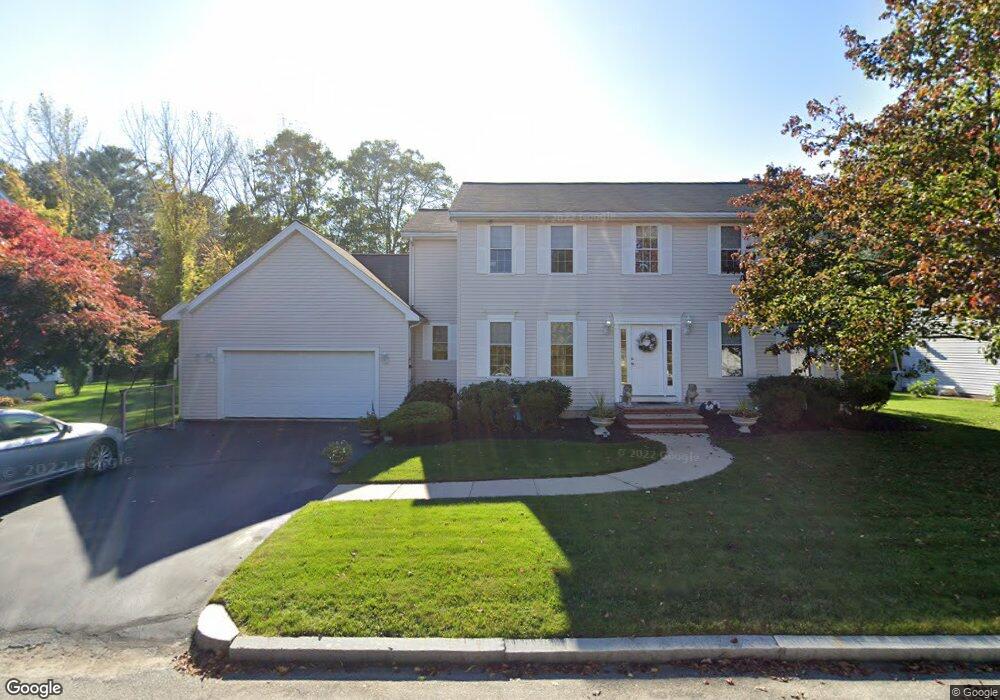
26 Crosby St Stoneham, MA 02180
Lindenwood NeighborhoodEstimated Value: $989,000 - $1,349,000
About This Home
This home is located at 26 Crosby St, Stoneham, MA 02180 and is currently estimated at $1,117,651, approximately $495 per square foot. 26 Crosby St is a home located in Middlesex County with nearby schools including Stoneham High School, St. Patrick Elementary School, and St Joseph School.
Ownership History
We collect this data history from publicly available records. To have your information removed, we recommend requesting removal directly through your county’s website.
Purchase Details
Home Values in the Area
Average Home Value in this Area
Purchase History
We collect this data history from publicly available records. To have your information removed, we recommend requesting removal directly through your county’s website.
| Date | Buyer | Sale Price | Title Company |
|---|---|---|---|
| $364,900 | -- |
Mortgage History
We collect this data history from publicly available records. To have your information removed, we recommend requesting removal directly through your county’s website.
| Date | Status | Borrower | Loan Amount |
|---|---|---|---|
| Open | $200,000 |
Tax History
We collect this data history from publicly available records. To have your information removed, we recommend requesting removal directly through your county’s website.
| Year | Tax Paid | Tax Assessment Tax Assessment Total Assessment is a certain percentage of the fair market value that is determined by local assessors to be the total taxable value of land and additions on the property. | Land | Improvement |
|---|---|---|---|---|
| 2025 | $9,272 | $906,400 | $401,000 | $505,400 |
| 2024 | $8,878 | $838,300 | $371,000 | $467,300 |
| 2023 | $8,644 | $778,700 | $341,000 | $437,700 |
| 2022 | $7,634 | $733,300 | $321,000 | $412,300 |
| 2021 | $7,664 | $708,300 | $301,000 | $407,300 |
| 2020 | $7,625 | $706,700 | $301,000 | $405,700 |
| 2019 | $7,535 | $671,600 | $271,000 | $400,600 |
| 2018 | $6,652 | $637,300 | $261,000 | $376,300 |
| 2017 | $7,497 | $605,100 | $231,000 | $374,100 |
| 2016 | $7,282 | $573,400 | $231,000 | $342,400 |
| 2015 | $7,293 | $562,700 | $231,000 | $331,700 |
| 2014 | $7,225 | $535,600 | $221,000 | $314,600 |
Map
- 5 Concord Rd
- 2 O'Connor Ln
- 380 Salem St
- 15 George St
- 148 South St
- 57 Augustus Ct Unit 4006
- 120 North St
- 7 Dewey Ave
- 23 Augustus Ct Unit 4003
- 10 Magnolia Terrace
- 305 Salem St Unit 206
- 305 Salem St Unit 312
- 36 Abigail Way Unit 1009
- 295 Salem St Unit 99
- 295 Salem St Unit 98
- 63 Oak St
- 62 Abigail Way Unit 4006
- 62 Abigail Way Unit 4007
- 31 Jacob Way
- 1 Albert Dr Unit 8
Ask me questions while you tour the home.