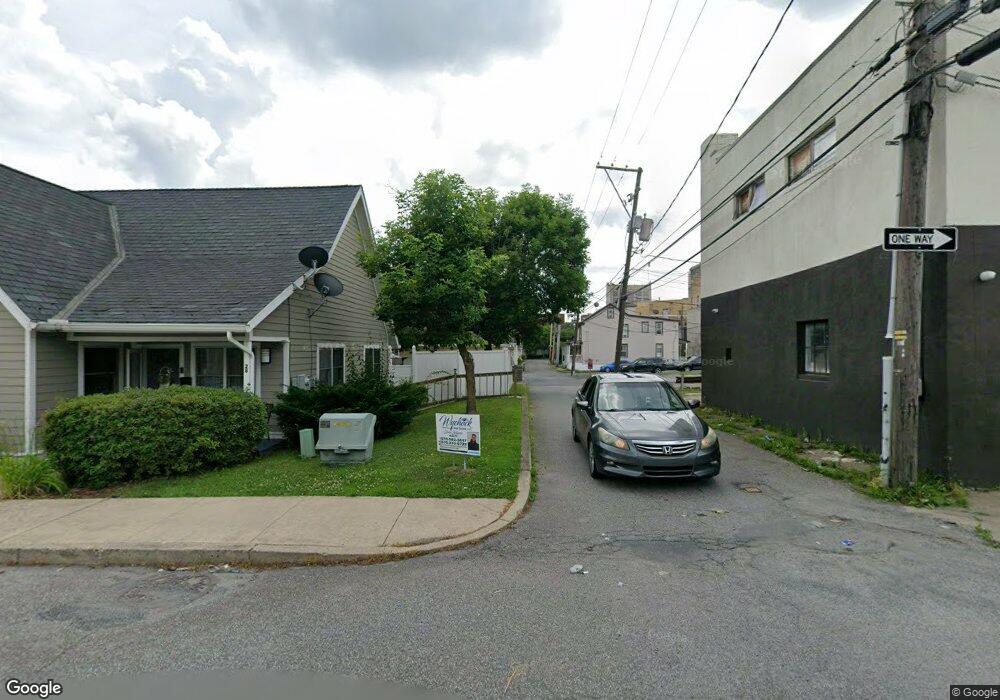
26 E Oak St West Hazleton, PA 18202
Estimated Value: $104,000 - $161,131
3
Beds
2
Baths
1,330
Sq Ft
$96/Sq Ft
Est. Value
About This Home
This home is located at 26 E Oak St, West Hazleton, PA 18202 and is currently estimated at $127,283, approximately $95 per square foot. 26 E Oak St is a home located in Luzerne County with nearby schools including Hazleton Area High School, Immanuel Christian School, and Bishop Hafey Junior/Senior High School.
Ownership History
Date
Name
Owned For
Owner Type
Purchase Details
Closed on
Aug 28, 2020
Sold by
Holderman Calvin J and Holderman Roxann
Bought by
Rodriguez Francisco J Garcia
Current Estimated Value
Home Financials for this Owner
Home Financials are based on the most recent Mortgage that was taken out on this home.
Original Mortgage
$57,950
Interest Rate
2.8%
Mortgage Type
New Conventional
Purchase Details
Closed on
May 7, 1979
Bought by
Holderman Calvin and Holderman Roxann
Create a Home Valuation Report for This Property
The Home Valuation Report is an in-depth analysis detailing your home's value as well as a comparison with similar homes in the area
Home Values in the Area
Average Home Value in this Area
Purchase History
| Date | Buyer | Sale Price | Title Company |
|---|---|---|---|
| Rodriguez Francisco J Garcia | $61,000 | Northeast Settlement Company | |
| Holderman Calvin | $14,000 | -- |
Source: Public Records
Mortgage History
| Date | Status | Borrower | Loan Amount |
|---|---|---|---|
| Previous Owner | Rodriguez Francisco J Garcia | $57,950 |
Source: Public Records
Tax History
| Year | Tax Paid | Tax Assessment Tax Assessment Total Assessment is a certain percentage of the fair market value that is determined by local assessors to be the total taxable value of land and additions on the property. | Land | Improvement |
|---|---|---|---|---|
| 2026 | $1,865 | $66,800 | $20,100 | $46,700 |
| 2025 | $1,685 | $66,800 | $20,100 | $46,700 |
| 2024 | $1,629 | $66,800 | $20,100 | $46,700 |
| 2023 | $1,587 | $66,800 | $20,100 | $46,700 |
| 2022 | $1,575 | $66,800 | $20,100 | $46,700 |
| 2021 | $1,536 | $66,800 | $20,100 | $46,700 |
| 2020 | $1,514 | $66,800 | $20,100 | $46,700 |
| 2019 | $1,397 | $66,800 | $20,100 | $46,700 |
| 2018 | $1,353 | $66,800 | $20,100 | $46,700 |
| 2017 | $1,329 | $66,800 | $20,100 | $46,700 |
| 2016 | -- | $66,800 | $20,100 | $46,700 |
| 2015 | $709 | $66,800 | $20,100 | $46,700 |
| 2014 | $709 | $66,800 | $20,100 | $46,700 |
Source: Public Records
Map
Nearby Homes
- 118 E Green St
- 60 E Jefferson Ave
- 1 W Diamond Ave
- 7 W Diamond Ave
- 239 Lincalis St
- 218 North St
- 328 W Green St
- 332 North St
- 360 W Spruce St
- 829 W 21st St
- 403 W 7th St
- AV1.022 Sisilla Dr
- 370 Inverness Ln
- EH-391 Birkdale Ct
- TV 202 Buttonbush & White Oak Ln
- 29 J Jahanna Cir
- 49 Creekside Dr
- 12 AV2 Opalanie Dr
- HF4.107 Acorn Dr
- Lot 11 Chippewa Dr
Your Personal Tour Guide
Ask me questions while you tour the home.