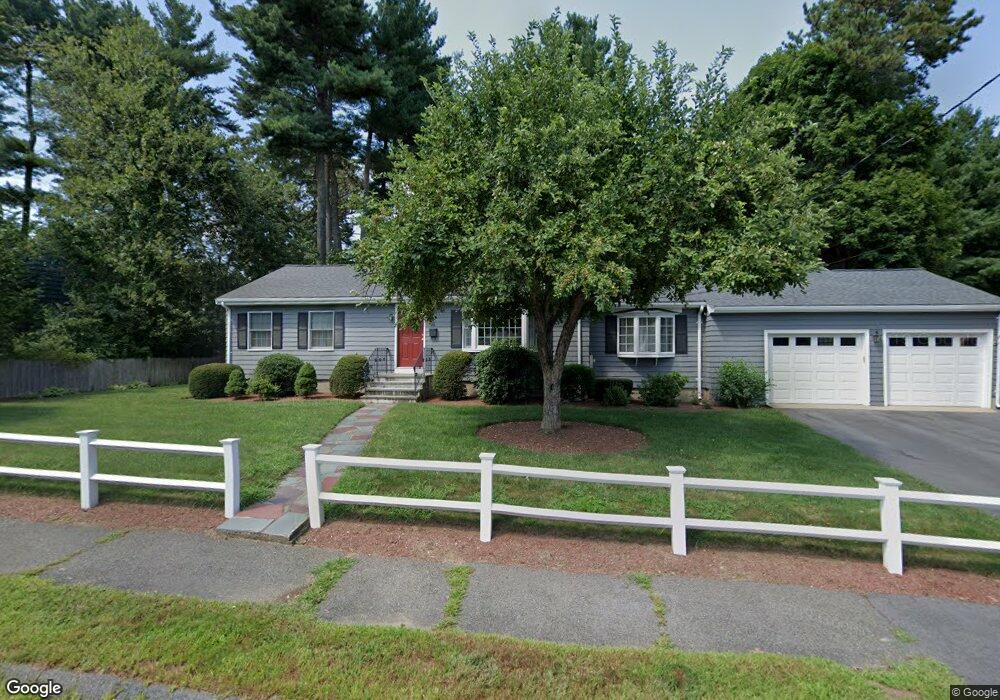
26 Felch Rd Natick, MA 01760
Estimated Value: $966,000 - $1,112,000
3
Beds
2
Baths
2,360
Sq Ft
$428/Sq Ft
Est. Value
About This Home
This home is located at 26 Felch Rd, Natick, MA 01760 and is currently estimated at $1,010,930, approximately $428 per square foot. 26 Felch Rd is a home located in Middlesex County with nearby schools including Natick High School, Bennett-Hemenway (Ben-Hem) Elementary School, and Wilson Middle School.
Ownership History
Date
Name
Owned For
Owner Type
Purchase Details
Closed on
Sep 4, 1987
Sold by
Cormier Margaret D
Bought by
Walsh William M
Current Estimated Value
Home Financials for this Owner
Home Financials are based on the most recent Mortgage that was taken out on this home.
Original Mortgage
$88,500
Interest Rate
10.28%
Mortgage Type
Purchase Money Mortgage
Create a Home Valuation Report for This Property
The Home Valuation Report is an in-depth analysis detailing your home's value as well as a comparison with similar homes in the area
Home Values in the Area
Average Home Value in this Area
Purchase History
| Date | Buyer | Sale Price | Title Company |
|---|---|---|---|
| Walsh William M | $178,500 | -- |
Source: Public Records
Mortgage History
| Date | Status | Borrower | Loan Amount |
|---|---|---|---|
| Open | Walsh William M | $165,000 | |
| Closed | Walsh William M | $132,000 | |
| Closed | Walsh William M | $25,000 | |
| Closed | Walsh William M | $88,500 |
Source: Public Records
Tax History
| Year | Tax Paid | Tax Assessment Tax Assessment Total Assessment is a certain percentage of the fair market value that is determined by local assessors to be the total taxable value of land and additions on the property. | Land | Improvement |
|---|---|---|---|---|
| 2025 | $9,194 | $768,700 | $427,000 | $341,700 |
| 2024 | $8,815 | $719,000 | $401,900 | $317,100 |
| 2023 | $8,843 | $699,600 | $386,600 | $313,000 |
| 2022 | $8,634 | $647,200 | $351,300 | $295,900 |
| 2021 | $8,263 | $607,100 | $331,200 | $275,900 |
| 2020 | $8,058 | $592,100 | $316,200 | $275,900 |
| 2019 | $7,526 | $592,100 | $316,200 | $275,900 |
| 2018 | $6,988 | $535,500 | $301,100 | $234,400 |
| 2017 | $6,563 | $486,500 | $256,400 | $230,100 |
| 2016 | $6,288 | $463,400 | $235,400 | $228,000 |
| 2015 | $6,110 | $442,100 | $235,400 | $206,700 |
Source: Public Records
Map
Nearby Homes
- 14 Drury Ln
- 278 N Main St
- 6 Cypress Rd
- 50 Wethersfield Rd
- 48 Wethersfield Rd
- 5 Bradford Rd
- 340 N Main St
- 4 Richard Rd
- 6 Ash St
- 1 Richard Rd
- 29 Irving Rd
- 8 Liberty St
- 25 Irving Rd
- 136 Commonwealth Rd
- 20 Wheeler Ln
- 78 E Plain St
- 13 Shawmut Avenue Extension
- 45 W Plain St Unit 1
- 8 Arlington Cir
- 186 Main St
Your Personal Tour Guide
Ask me questions while you tour the home.