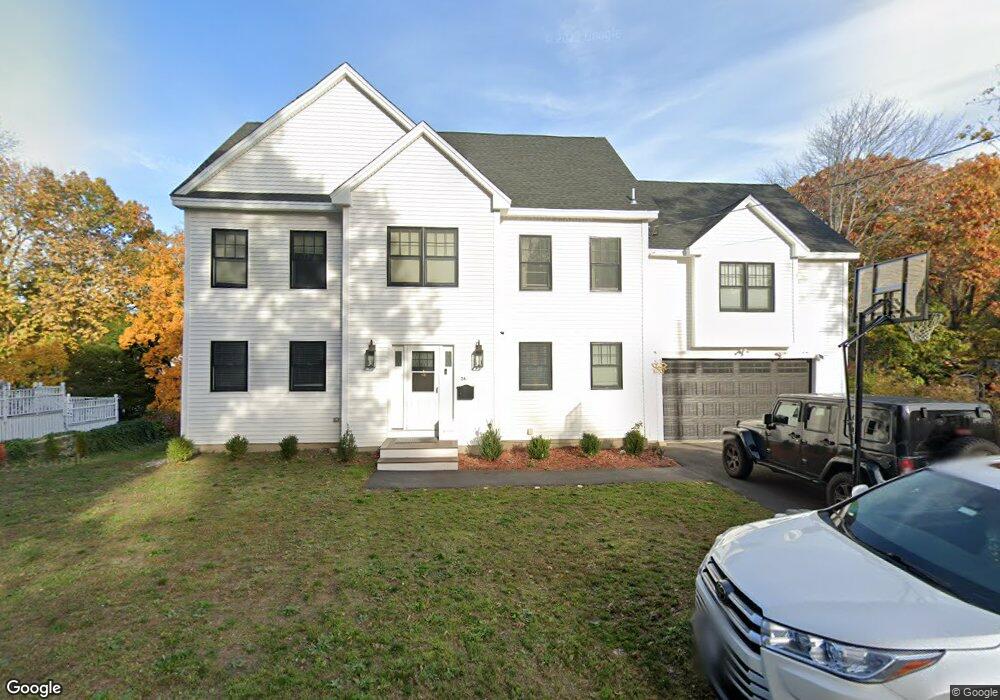
26 Harrison Ave Wakefield, MA 01880
Greenwood NeighborhoodEstimated Value: $1,248,000 - $1,331,000
About This Home
This home is located at 26 Harrison Ave, Wakefield, MA 01880 and is currently estimated at $1,292,559, approximately $461 per square foot. 26 Harrison Ave is a home located in Middlesex County with nearby schools including Wakefield Memorial High School, Melrose Montessori School, and St Joseph School.
Ownership History
We collect this data history from publicly available records. To have your information removed, we recommend requesting removal directly through your county’s website.
Purchase Details
Home Values in the Area
Average Home Value in this Area
Purchase History
We collect this data history from publicly available records. To have your information removed, we recommend requesting removal directly through your county’s website.
| Date | Buyer | Sale Price | Title Company |
|---|---|---|---|
| -- | -- |
Mortgage History
We collect this data history from publicly available records. To have your information removed, we recommend requesting removal directly through your county’s website.
| Date | Status | Borrower | Loan Amount |
|---|---|---|---|
| Closed | $30,000 | ||
| Closed | $160,000 | ||
| Closed | $190,000 | ||
| Closed | $45,000 |
Tax History
We collect this data history from publicly available records. To have your information removed, we recommend requesting removal directly through your county’s website.
| Year | Tax Paid | Tax Assessment Tax Assessment Total Assessment is a certain percentage of the fair market value that is determined by local assessors to be the total taxable value of land and additions on the property. | Land | Improvement |
|---|---|---|---|---|
| 2025 | $12,184 | $1,073,500 | $376,400 | $697,100 |
| 2024 | $12,007 | $1,067,300 | $374,200 | $693,100 |
| 2023 | $11,418 | $973,400 | $341,300 | $632,100 |
| 2022 | $10,922 | $886,500 | $310,800 | $575,700 |
| 2021 | $8,589 | $674,700 | $289,700 | $385,000 |
| 2020 | $5,773 | $452,100 | $270,800 | $181,300 |
| 2019 | $5,516 | $429,900 | $257,500 | $172,400 |
| 2018 | $5,135 | $396,500 | $237,500 | $159,000 |
| 2017 | $4,829 | $370,600 | $222,000 | $148,600 |
| 2016 | $4,731 | $350,700 | $210,000 | $140,700 |
| 2015 | $4,416 | $327,600 | $196,200 | $131,400 |
| 2014 | $4,027 | $315,100 | $188,700 | $126,400 |
Map
- 35 Kendrick Rd
- 95 Greenwood Ave
- 974 Main St Unit 23
- 18 Hanson St
- 33 Ledge St
- 30 Golden Hills Rd
- 2 Gates Ln Unit B
- 24 Mount Zion Rd
- 6 Atwood St
- 22 Mount Zion Rd
- 17 Heywood Ave
- 48 Spring St
- 3 Fellsmere Ave
- 12 Lovis Ave
- 25 Fellsmere Ave
- 24 Juniper Dr
- 760 Lynn Fells Pkwy
- 601 Franklin St Unit 2
- 3 Carmen Ave
- 161 Green St
Ask me questions while you tour the home.