26 High St Sharon, MA 02067
Sharon AreaEstimated Value: $887,000 - $983,000
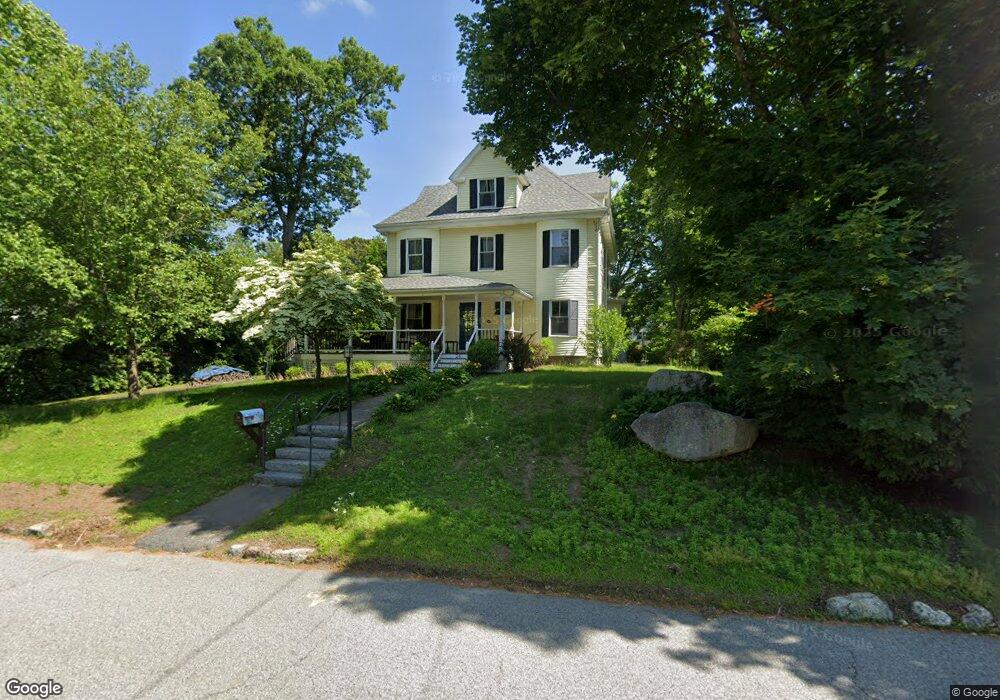
About This Home
This home is located at 26 High St, Sharon, MA 02067 and is currently estimated at $936,388, approximately $370 per square foot. 26 High St is a home located in Norfolk County with nearby schools including Cottage Street Elementary School, Sharon Middle School, and Sharon High School.
Ownership History
We collect this data history from publicly available records. To have your information removed, we recommend requesting removal directly through your county’s website.
Purchase Details
Purchase Details
Home Values in the Area
Average Home Value in this Area
Purchase History
We collect this data history from publicly available records. To have your information removed, we recommend requesting removal directly through your county’s website.
| Date | Buyer | Sale Price | Title Company |
|---|---|---|---|
| -- | None Available | ||
| $230,000 | -- |
Mortgage History
We collect this data history from publicly available records. To have your information removed, we recommend requesting removal directly through your county’s website.
| Date | Status | Borrower | Loan Amount |
|---|---|---|---|
| Previous Owner | $70,000 |
Tax History
We collect this data history from publicly available records. To have your information removed, we recommend requesting removal directly through your county’s website.
| Year | Tax Paid | Tax Assessment Tax Assessment Total Assessment is a certain percentage of the fair market value that is determined by local assessors to be the total taxable value of land and additions on the property. | Land | Improvement |
|---|---|---|---|---|
| 2025 | $13,358 | $764,200 | $406,400 | $357,800 |
| 2024 | $12,795 | $727,800 | $372,900 | $354,900 |
| 2023 | $12,240 | $658,400 | $348,500 | $309,900 |
| 2022 | $11,583 | $586,500 | $290,400 | $296,100 |
| 2021 | $11,478 | $561,800 | $274,000 | $287,800 |
| 2020 | $10,910 | $574,200 | $286,400 | $287,800 |
| 2019 | $10,291 | $530,200 | $242,400 | $287,800 |
| 2018 | $10,179 | $525,500 | $237,700 | $287,800 |
| 2017 | $10,006 | $510,000 | $222,200 | $287,800 |
| 2016 | $10,200 | $507,200 | $244,400 | $262,800 |
| 2015 | $9,504 | $468,200 | $227,900 | $240,300 |
| 2014 | $8,812 | $428,800 | $207,200 | $221,600 |
Map
- 58 Summit Ave
- 62 Summit Ave
- 133 Pond St
- 99 Brook Rd
- 18 Terrapin Ln
- 58 Ames St
- 37 Lantern Ln
- 4 Knife Shop Ln
- 7 Marie Ave
- 175 East St
- 175 Maskwonicut St
- 15 Pond View Cir
- 2 Trowel Shop Pond Rd Unit 2
- 2 East St
- 24 Pleasant Park Rd
- 40 Gunhouse St
- 50 Arboro Dr
- 14 Baldwin Dr Unit 14
- 6 Sandy Ridge Cir
- 50 Mountain St
Ask me questions while you tour the home.