26 Hurlburt Rd Reading, MA 01867
Estimated Value: $1,189,827 - $1,405,000
3
Beds
3
Baths
3,369
Sq Ft
$375/Sq Ft
Est. Value
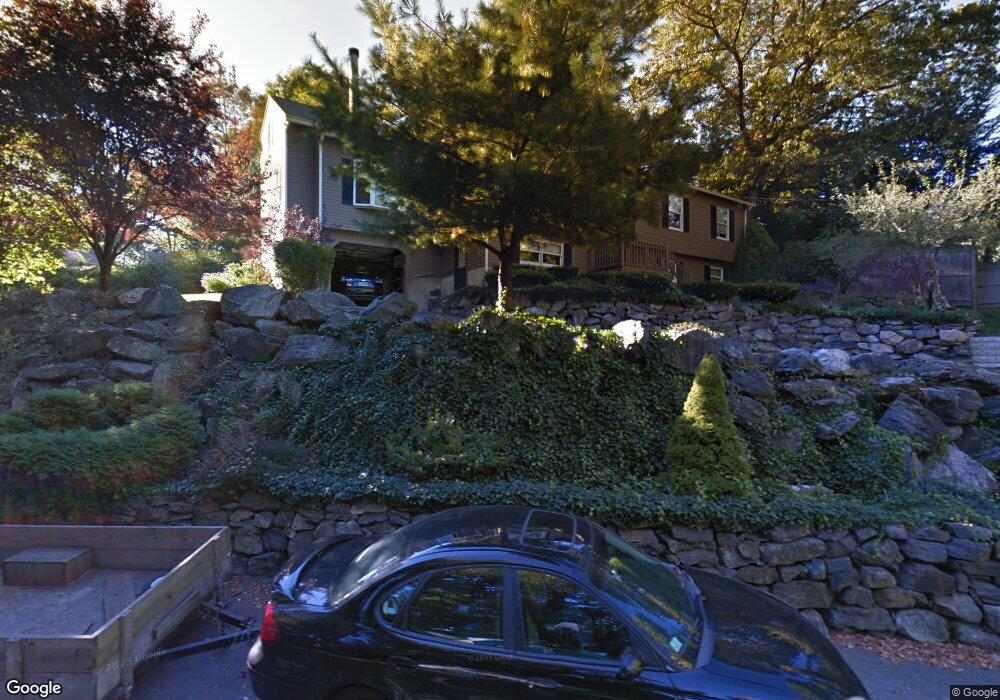
About This Home
This home is located at 26 Hurlburt Rd, Reading, MA 01867 and is currently estimated at $1,262,207, approximately $374 per square foot. 26 Hurlburt Rd is a home located in Middlesex County with nearby schools including Birch Meadow Elementary School, Arthur W. Coolidge Middle School, and Reading Memorial High School.
Ownership History
Date
Name
Owned For
Owner Type
Purchase Details
Closed on
Jun 6, 2024
Sold by
Romano John A and Romano Pamela A
Bought by
Romano Ft and Romano
Current Estimated Value
Create a Home Valuation Report for This Property
The Home Valuation Report is an in-depth analysis detailing your home's value as well as a comparison with similar homes in the area
Home Values in the Area
Average Home Value in this Area
Purchase History
We collect this data history from publicly available records. To have your information removed, we recommend requesting removal directly through your county’s website.
| Date | Buyer | Sale Price | Title Company |
|---|---|---|---|
| Romano Ft | -- | None Available | |
| Romano Ft | -- | None Available |
Source: Public Records
Tax History
| Year | Tax Paid | Tax Assessment Tax Assessment Total Assessment is a certain percentage of the fair market value that is determined by local assessors to be the total taxable value of land and additions on the property. | Land | Improvement |
|---|---|---|---|---|
| 2025 | $10,750 | $943,800 | $423,200 | $520,600 |
| 2024 | $10,628 | $906,800 | $406,600 | $500,200 |
| 2023 | $10,297 | $817,900 | $366,600 | $451,300 |
| 2022 | $9,915 | $743,800 | $333,300 | $410,500 |
| 2021 | $9,681 | $718,300 | $319,300 | $399,000 |
| 2020 | $9,539 | $683,800 | $303,900 | $379,900 |
| 2019 | $9,269 | $651,400 | $289,400 | $362,000 |
| 2018 | $8,523 | $614,500 | $273,000 | $341,500 |
| 2017 | $11,969 | $579,800 | $257,500 | $322,300 |
| 2016 | $7,317 | $504,600 | $190,400 | $314,200 |
| 2015 | $7,066 | $480,700 | $181,300 | $299,400 |
| 2014 | $6,751 | $458,000 | $172,700 | $285,300 |
Source: Public Records
Map
Nearby Homes
Your Personal Tour Guide
Ask me questions while you tour the home.