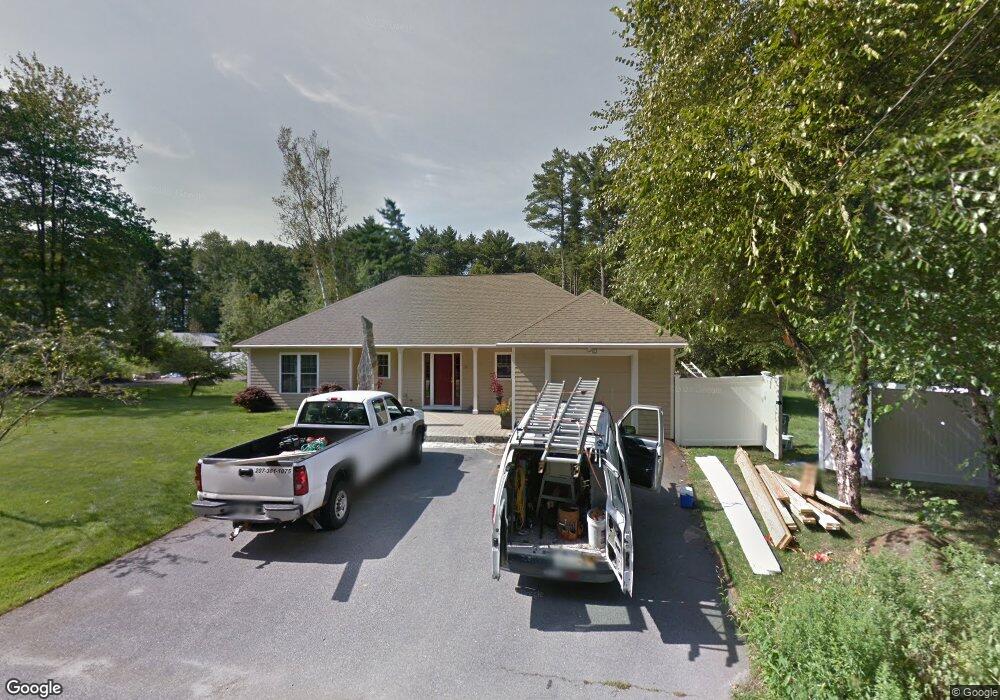
26 Logging Rd Cape Neddick, ME 03902
Ogunquit NeighborhoodEstimated Value: $677,000 - $1,059,000
Studio
--
Bath
--
Sq Ft
35,284
Sq Ft Lot
About This Home
This home is located at 26 Logging Rd, Cape Neddick, ME 03902 and is currently estimated at $896,814. 26 Logging Rd is a home located in York County with nearby schools including Coastal Ridge Elementary School, Village Elementary School, and York Middle School.
Ownership History
Date
Name
Owned For
Owner Type
Purchase Details
Closed on
May 10, 2011
Sold by
Flowers Linda
Bought by
Bedard Marc
Current Estimated Value
Home Financials for this Owner
Home Financials are based on the most recent Mortgage that was taken out on this home.
Original Mortgage
$220,000
Outstanding Balance
$149,937
Interest Rate
4.85%
Mortgage Type
Purchase Money Mortgage
Estimated Equity
$746,877
Create a Home Valuation Report for This Property
The Home Valuation Report is an in-depth analysis detailing your home's value as well as a comparison with similar homes in the area
Home Values in the Area
Average Home Value in this Area
Purchase History
| Date | Buyer | Sale Price | Title Company |
|---|---|---|---|
| Bedard Marc | -- | -- | |
| Bedard Marc | -- | -- | |
| Bedard Marc A | -- | -- | |
| Bedard Marc A | -- | -- |
Source: Public Records
Mortgage History
| Date | Status | Borrower | Loan Amount |
|---|---|---|---|
| Open | Bedard Marc | $220,000 | |
| Closed | Bedard Marc | $220,000 | |
| Previous Owner | Bedard Marc | $175,000 |
Source: Public Records
Tax History
| Year | Tax Paid | Tax Assessment Tax Assessment Total Assessment is a certain percentage of the fair market value that is determined by local assessors to be the total taxable value of land and additions on the property. | Land | Improvement |
|---|---|---|---|---|
| 2025 | $7,254 | $879,300 | $209,700 | $669,600 |
| 2024 | $6,838 | $814,000 | $209,700 | $604,300 |
| 2023 | $6,392 | $756,500 | $152,200 | $604,300 |
| 2022 | $5,974 | $698,700 | $127,200 | $571,500 |
| 2021 | $5,702 | $598,100 | $118,400 | $479,700 |
| 2020 | $5,226 | $495,800 | $118,400 | $377,400 |
| 2019 | $5,262 | $471,900 | $98,100 | $373,800 |
| 2018 | $3,430 | $468,400 | $98,100 | $370,300 |
| 2017 | $4,075 | $470,200 | $98,100 | $372,100 |
| 2016 | $5,185 | $465,000 | $91,300 | $373,700 |
| 2015 | $4,975 | $452,300 | $87,900 | $364,400 |
| 2014 | $4,840 | $452,300 | $87,900 | $364,400 |
| 2013 | $4,837 | $463,800 | $84,600 | $379,200 |
Source: Public Records
Map
Nearby Homes
Your Personal Tour Guide
Ask me questions while you tour the home.