Estimated Value: $199,000 - $272,000
Studio
--
Bath
2,640
Sq Ft
$90/Sq Ft
Est. Value
About This Home
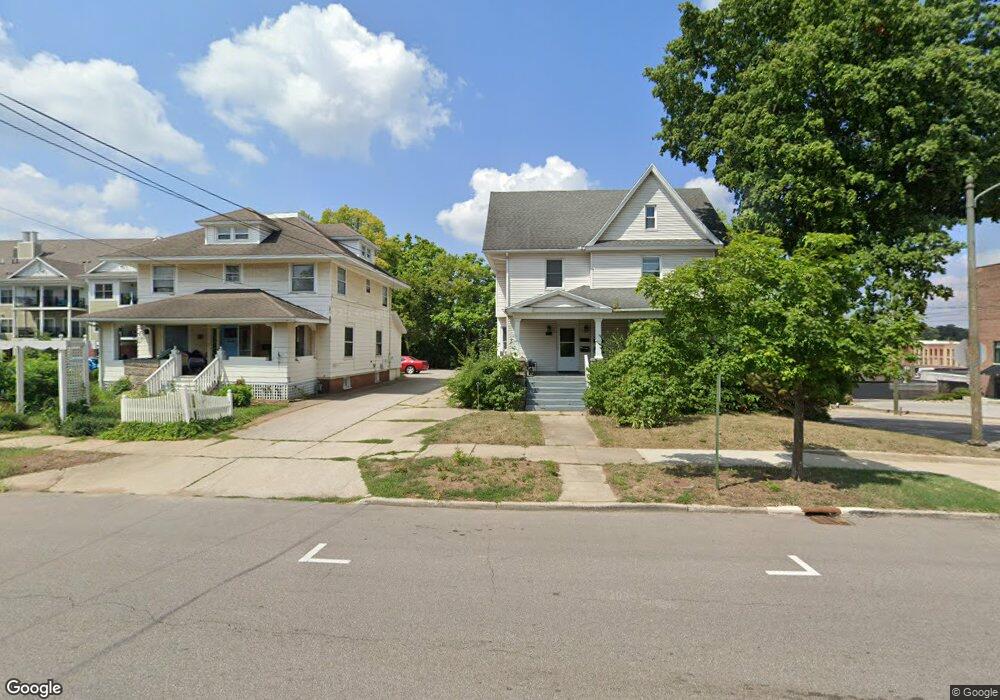
This home is located at 26 N 3rd St, Niles, MI 49120 and is currently estimated at $236,377, approximately $89 per square foot. 26 N 3rd St is a home with nearby schools including Ballard Elementary School, Oak Manor Sixth Grade Center, and Ring Lardner Middle School.
Ownership History
Date
Name
Owned For
Owner Type
Purchase Details
Closed on
Aug 30, 2021
Sold by
Ogden Jean Shirley and Earl Dean Ogden Trust
Bought by
Frogman Investments Llc
Current Estimated Value
Home Financials for this Owner
Home Financials are based on the most recent Mortgage that was taken out on this home.
Original Mortgage
$140,000
Outstanding Balance
$127,246
Interest Rate
2.87%
Estimated Equity
$109,131
Purchase Details
Closed on
Aug 23, 2016
Sold by
Ogden Jean Shirley and Ogden Earl Dean
Bought by
Earl Dean Ogden Trust
Purchase Details
Closed on
Aug 28, 1996
Purchase Details
Closed on
Mar 14, 1986
Create a Home Valuation Report for This Property
The Home Valuation Report is an in-depth analysis detailing your home's value as well as a comparison with similar homes in the area
Home Values in the Area
Average Home Value in this Area
Purchase History
We collect this data history from publicly available records. To have your information removed, we recommend requesting removal directly through your county’s website.
| Date | Buyer | Sale Price | Title Company |
|---|---|---|---|
| Frogman Investments Llc | -- | None Available | |
| Earl Dean Ogden Trust | -- | Attorney | |
| -- | -- | -- | |
| -- | $33,000 | -- |
Source: Public Records
Mortgage History
We collect this data history from publicly available records. To have your information removed, we recommend requesting removal directly through your county’s website.
| Date | Status | Borrower | Loan Amount |
|---|---|---|---|
| Open | Frogman Investments Llc | $140,000 |
Source: Public Records
Tax History
| Year | Tax Paid | Tax Assessment Tax Assessment Total Assessment is a certain percentage of the fair market value that is determined by local assessors to be the total taxable value of land and additions on the property. | Land | Improvement |
|---|---|---|---|---|
| 2025 | $3,063 | $64,900 | $0 | $0 |
| 2024 | $1,569 | $66,900 | $0 | $0 |
| 2023 | $1,504 | $61,600 | $0 | $0 |
| 2022 | $1,433 | $47,800 | $0 | $0 |
| 2021 | $2,104 | $61,800 | $1,400 | $60,400 |
| 2020 | $2,080 | $56,100 | $0 | $0 |
| 2019 | $2,051 | $48,700 | $6,600 | $42,100 |
| 2018 | $1,978 | $48,700 | $0 | $0 |
| 2017 | $1,957 | $51,000 | $0 | $0 |
| 2016 | $1,924 | $49,300 | $0 | $0 |
| 2015 | $1,918 | $49,300 | $0 | $0 |
| 2014 | $979 | $47,300 | $0 | $0 |
Source: Public Records
Map
Nearby Homes
Your Personal Tour Guide
Ask me questions while you tour the home.