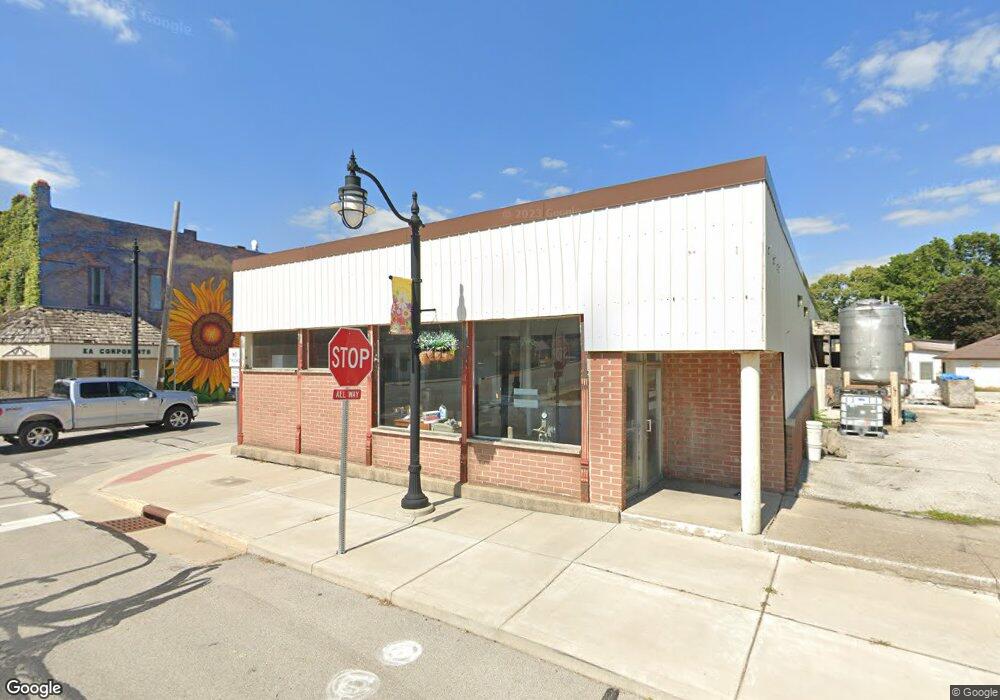
26 N Main St Otterbein, IN 47970
Estimated Value: $117,864 - $156,000
1
Bed
1
Bath
672
Sq Ft
$199/Sq Ft
Est. Value
About This Home
This home is located at 26 N Main St, Otterbein, IN 47970 and is currently estimated at $133,716, approximately $198 per square foot. 26 N Main St is a home with nearby schools including Benton Central Junior/Senior High School.
Ownership History
Date
Name
Owned For
Owner Type
Purchase Details
Closed on
Feb 7, 2023
Sold by
Gallinger Candy Lee
Bought by
Black Dawg Llc
Current Estimated Value
Home Financials for this Owner
Home Financials are based on the most recent Mortgage that was taken out on this home.
Original Mortgage
$66,000
Outstanding Balance
$60,537
Interest Rate
6.27%
Mortgage Type
Construction
Estimated Equity
$73,179
Purchase Details
Closed on
Dec 3, 2019
Sold by
Sturgeon Joward W Est
Bought by
Sturgeon Jean
Create a Home Valuation Report for This Property
The Home Valuation Report is an in-depth analysis detailing your home's value as well as a comparison with similar homes in the area
Purchase History
| Date | Buyer | Sale Price | Title Company |
|---|---|---|---|
| Black Dawg Llc | $45,000 | -- | |
| Sturgeon Jean | -- | None Available |
Source: Public Records
Mortgage History
| Date | Status | Borrower | Loan Amount |
|---|---|---|---|
| Open | Black Dawg Llc | $66,000 |
Source: Public Records
Tax History
| Year | Tax Paid | Tax Assessment Tax Assessment Total Assessment is a certain percentage of the fair market value that is determined by local assessors to be the total taxable value of land and additions on the property. | Land | Improvement |
|---|---|---|---|---|
| 2025 | $2,061 | $92,600 | $11,000 | $81,600 |
| 2024 | $2,061 | $91,200 | $11,000 | $80,200 |
| 2023 | $47 | $67,000 | $10,100 | $56,900 |
| 2022 | $50 | $62,200 | $10,100 | $52,100 |
| 2021 | $34 | $59,600 | $10,100 | $49,500 |
| 2020 | $5 | $51,700 | $10,100 | $41,600 |
| 2019 | $5 | $48,200 | $9,800 | $38,400 |
| 2018 | $0 | $43,100 | $9,800 | $33,300 |
| 2017 | $0 | $39,700 | $9,800 | $29,900 |
| 2016 | $24 | $37,600 | $9,800 | $27,800 |
| 2014 | -- | $41,800 | $12,500 | $29,300 |
| 2013 | -- | $37,800 | $11,400 | $26,400 |
Source: Public Records
Map
Nearby Homes
- 409 E 2nd St
- 10240 E 975 N Unit 31
- 10872 N 875 E
- 3408 Apple Ln
- 2440 N 650 W
- 0 Andrew Dr
- 1826 Arrowhead Dr
- 5940 Conkright Ln
- 7113 E 600 S
- 1 Adeway Ct
- 14 S 875 W
- 1570 Rosco Dr
- 9307 W 1300 S
- 5228 State Road 26 W
- 4751 Pleasant Valley Dr
- 3913 Sunnycroft Place
- 60 Carrington Ct
- 4231 Black Forest Ln
- 3827 Sunnycroft Place
- 4120 Black Forest Ln
- 28 N Main St
- 24 E Peterson St
- 27 W Oxford St
- 29 W Oxford St
- 24 W Peterson St
- 27 W Peterson St
- 21 E Peterson St
- 23 Peterson St
- 26 W Peterson St
- 110 N Columbia St
- 27 E Oxford St
- 108 N Columbia St
- 30 W Oxford St
- 32 W Oxford St
- 27 E Peterson St
- 106 N Columbia St
- 108 N Main St
- 28 W Peterson St
- 107 S Main St
- 107 N Columbia St
Your Personal Tour Guide
Ask me questions while you tour the home.