26 Pine Cone Rd Moultrie, GA 31768
Estimated Value: $259,000 - $349,000
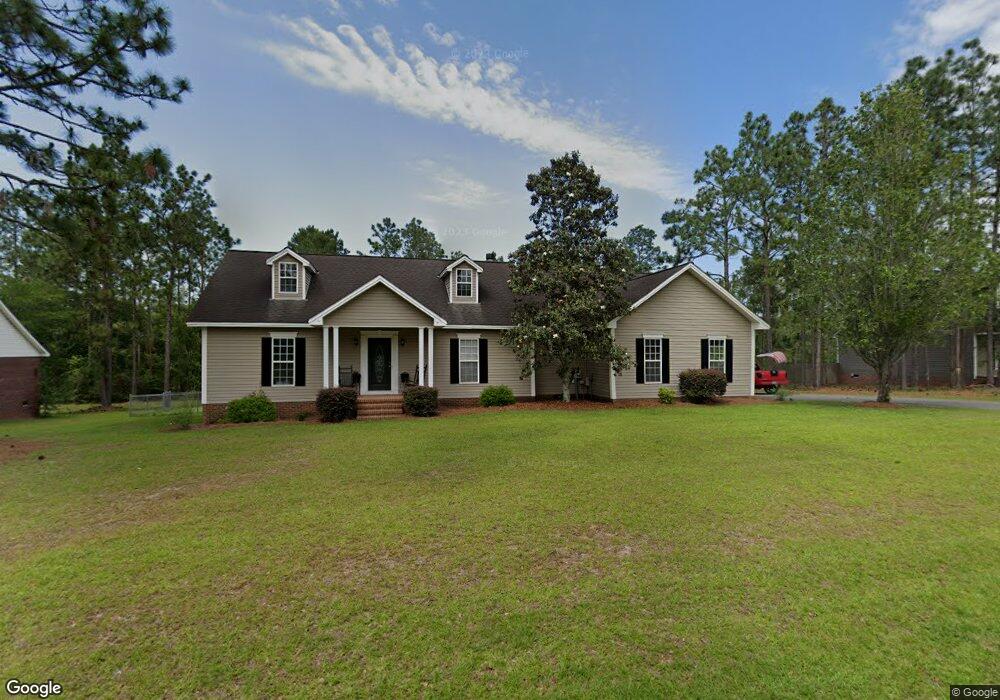
About This Home
This home is located at 26 Pine Cone Rd, Moultrie, GA 31768 and is currently estimated at $313,513, approximately $162 per square foot. 26 Pine Cone Rd is a home located in Colquitt County with nearby schools including Sunset Elementary School, Willie J. Williams Middle School, and C.A. Gray Junior High School.
Ownership History
We collect this data history from publicly available records. To have your information removed, we recommend requesting removal directly through your county’s website.
Purchase Details
Home Financials for this Owner
Home Financials are based on the most recent Mortgage that was taken out on this home.Purchase Details
Purchase Details
Purchase History
We collect this data history from publicly available records. To have your information removed, we recommend requesting removal directly through your county’s website.
| Date | Buyer | Sale Price | Title Company |
|---|---|---|---|
| $257,200 | -- | ||
| $142,000 | -- | ||
| $25,000 | -- |
Mortgage History
We collect this data history from publicly available records. To have your information removed, we recommend requesting removal directly through your county’s website.
| Date | Status | Borrower | Loan Amount |
|---|---|---|---|
| Open | $257,200 |
Tax History
We collect this data history from publicly available records. To have your information removed, we recommend requesting removal directly through your county’s website.
| Year | Tax Paid | Tax Assessment Tax Assessment Total Assessment is a certain percentage of the fair market value that is determined by local assessors to be the total taxable value of land and additions on the property. | Land | Improvement |
|---|---|---|---|---|
| 2025 | $3,378 | $117,320 | $12,000 | $105,320 |
| 2024 | $3,378 | $108,831 | $12,000 | $96,831 |
| 2023 | $3,105 | $94,857 | $12,000 | $82,857 |
| 2022 | $2,638 | $80,316 | $12,000 | $68,316 |
| 2021 | $2,574 | $77,421 | $12,000 | $65,421 |
| 2020 | $2,617 | $77,421 | $12,000 | $65,421 |
| 2019 | $2,803 | $73,710 | $12,000 | $61,710 |
| 2018 | $2,944 | $73,710 | $12,000 | $61,710 |
| 2017 | $2,774 | $73,710 | $12,000 | $61,710 |
| 2016 | $2,889 | $73,710 | $12,000 | $61,710 |
| 2015 | $2,740 | $69,781 | $12,000 | $57,781 |
| 2014 | $2,806 | $69,781 | $12,000 | $57,781 |
| 2013 | -- | $69,781 | $12,000 | $57,781 |
Map
- 15 Pine Cone Rd
- 0 Hummingbird Ln
- 10 Hummingbird Rd
- 306 Holly Trail
- 7 Lakeview Cove
- 305 Clubview Dr
- 203 Lakeshore Dr
- 126 Sunset Cir
- 20 Cherokee Rd
- 204 Nandina Dr
- 0 Silverwood Ct
- 387 Tanglewood Dr
- 2216 Azalea Dr
- 2600 Jacqueline Cir
- 2005 S Main St
- 2001 S Main St
- 2004 4th St SE
- 104 Pearl St SE
- 1907 4th St SE
- 36 Cobblestone Blvd SE
Ask me questions while you tour the home.