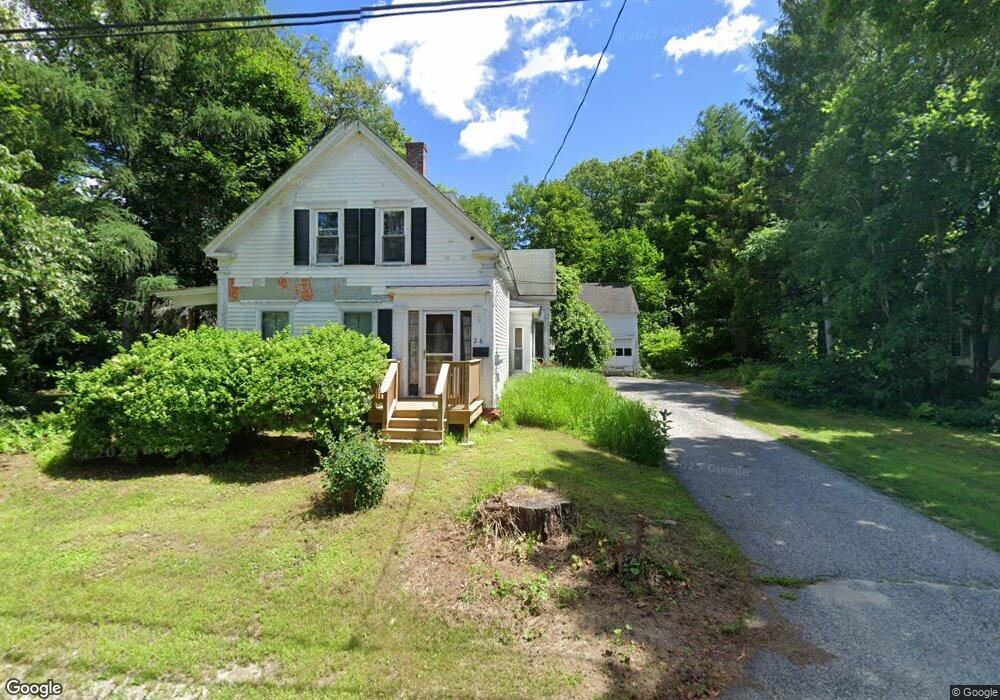
26 Pine St Mechanic Falls, ME 04256
Estimated Value: $246,000 - $302,000
3
Beds
1
Bath
1,192
Sq Ft
$230/Sq Ft
Est. Value
About This Home
This home is located at 26 Pine St, Mechanic Falls, ME 04256 and is currently estimated at $273,817, approximately $229 per square foot. 26 Pine St is a home with nearby schools including Elm Street School - Mechanic Falls and Poland Spring Academy.
Ownership History
Date
Name
Owned For
Owner Type
Purchase Details
Closed on
Oct 12, 2012
Sold by
Bowes Dev Llc
Bought by
Mckeen Richard E and Mckeen Patricia
Current Estimated Value
Purchase Details
Closed on
Sep 8, 2008
Sold by
Gurney Thomas D and Gurney Joan E
Bought by
Bellegarde Rebekah M
Home Financials for this Owner
Home Financials are based on the most recent Mortgage that was taken out on this home.
Original Mortgage
$119,059
Interest Rate
6.69%
Mortgage Type
FHA
Create a Home Valuation Report for This Property
The Home Valuation Report is an in-depth analysis detailing your home's value as well as a comparison with similar homes in the area
Home Values in the Area
Average Home Value in this Area
Purchase History
| Date | Buyer | Sale Price | Title Company |
|---|---|---|---|
| Mckeen Richard E | -- | -- | |
| Bellegarde Rebekah M | -- | -- |
Source: Public Records
Mortgage History
| Date | Status | Borrower | Loan Amount |
|---|---|---|---|
| Previous Owner | Bellegarde Rebekah M | $119,059 |
Source: Public Records
Tax History
| Year | Tax Paid | Tax Assessment Tax Assessment Total Assessment is a certain percentage of the fair market value that is determined by local assessors to be the total taxable value of land and additions on the property. | Land | Improvement |
|---|---|---|---|---|
| 2025 | $2,624 | $176,113 | $43,024 | $133,089 |
| 2024 | $2,712 | $176,113 | $43,024 | $133,089 |
| 2023 | $2,466 | $176,113 | $43,024 | $133,089 |
| 2022 | $2,475 | $111,219 | $20,486 | $90,733 |
| 2021 | $2,402 | $111,219 | $20,486 | $90,733 |
| 2020 | $2,386 | $111,219 | $20,486 | $90,733 |
| 2019 | $1,347 | $111,219 | $20,486 | $90,733 |
| 2018 | $1,287 | $111,219 | $20,486 | $90,733 |
| 2017 | $1,287 | $111,219 | $20,486 | $90,733 |
| 2016 | $2,371 | $111,219 | $20,486 | $90,733 |
| 2015 | $2,380 | $111,219 | $20,486 | $90,733 |
| 2014 | $2,358 | $111,219 | $20,486 | $90,733 |
Source: Public Records
Map
Nearby Homes
- 11 Pine St
- 17 Water St
- 125 S Main St
- 138 Lewiston St
- 62 N Main St
- 107 Riverside Dr
- 18 Purington Ave
- 19 Tirrell Ave
- 62 North St
- 232 Grange Ave
- 17 Walker Rd
- 9 Raspberry Hill Rd
- 0 North St
- 78 Star Dr
- Lot 2 Lane Rd
- Lot 7 Lane Rd
- 44 Stone Brooke Dr
- 125 Pigeon Hill Rd
- Lot 14C Mechanic Falls Rd
- Lot 5 Pigeon Hill Rd
Your Personal Tour Guide
Ask me questions while you tour the home.