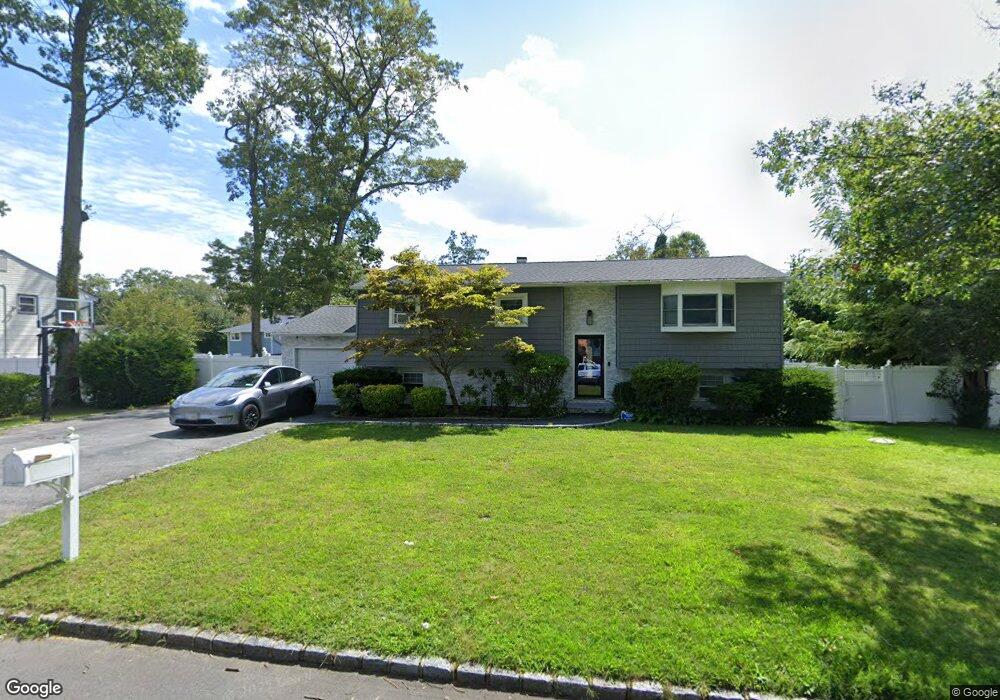
26 Pitcher St West Babylon, NY 11704
Estimated Value: $563,000 - $722,000
4
Beds
2
Baths
2,134
Sq Ft
$302/Sq Ft
Est. Value
About This Home
This home is located at 26 Pitcher St, West Babylon, NY 11704 and is currently estimated at $643,597, approximately $301 per square foot. 26 Pitcher St is a home located in Suffolk County with nearby schools including Robert Moses Middle School and North Babylon High School.
Ownership History
Date
Name
Owned For
Owner Type
Purchase Details
Closed on
May 30, 2017
Sold by
Saunders Keith
Bought by
Rucker Joshua C
Current Estimated Value
Home Financials for this Owner
Home Financials are based on the most recent Mortgage that was taken out on this home.
Original Mortgage
$304,741
Outstanding Balance
$256,741
Interest Rate
4.5%
Mortgage Type
FHA
Estimated Equity
$386,856
Purchase Details
Closed on
Aug 10, 2016
Sold by
Saunders Keith D
Bought by
Saunders Keith
Create a Home Valuation Report for This Property
The Home Valuation Report is an in-depth analysis detailing your home's value as well as a comparison with similar homes in the area
Home Values in the Area
Average Home Value in this Area
Purchase History
| Date | Buyer | Sale Price | Title Company |
|---|---|---|---|
| Rucker Joshua C | $315,000 | None Available | |
| Saunders Keith | -- | None Available |
Source: Public Records
Mortgage History
| Date | Status | Borrower | Loan Amount |
|---|---|---|---|
| Open | Rucker Joshua C | $304,741 |
Source: Public Records
Tax History
| Year | Tax Paid | Tax Assessment Tax Assessment Total Assessment is a certain percentage of the fair market value that is determined by local assessors to be the total taxable value of land and additions on the property. | Land | Improvement |
|---|---|---|---|---|
| 2024 | $12,653 | $3,660 | $280 | $3,380 |
| 2023 | $12,653 | $3,660 | $280 | $3,380 |
| 2022 | $9,431 | $3,660 | $280 | $3,380 |
| 2021 | $9,431 | $3,660 | $280 | $3,380 |
| 2020 | $11,093 | $3,660 | $280 | $3,380 |
| 2019 | $11,093 | $0 | $0 | $0 |
| 2018 | $9,616 | $3,660 | $280 | $3,380 |
| 2017 | $9,616 | $3,660 | $280 | $3,380 |
| 2016 | $9,485 | $3,660 | $280 | $3,380 |
| 2015 | -- | $3,660 | $280 | $3,380 |
| 2014 | -- | $3,660 | $280 | $3,380 |
Source: Public Records
Map
Nearby Homes
- 91 Putnam Ave
- 57 Rockland Ave
- 751 Centerwood St
- 359 Erlanger Blvd
- 313 Warren St
- 629 Lakeway Dr
- 351 State Ave
- 221 Young St
- 25 Young St
- 58 Brook Ave
- 340 Westchester Ave
- 295 W 24th St
- 148 E Booker Ave
- 135 Cumberbach St
- 35 Saint Johns Place
- 141 Davidson St
- 335 Alfred St
- 305 W 20th St
- 259 W 24th St
- 185 Throop St
Your Personal Tour Guide
Ask me questions while you tour the home.