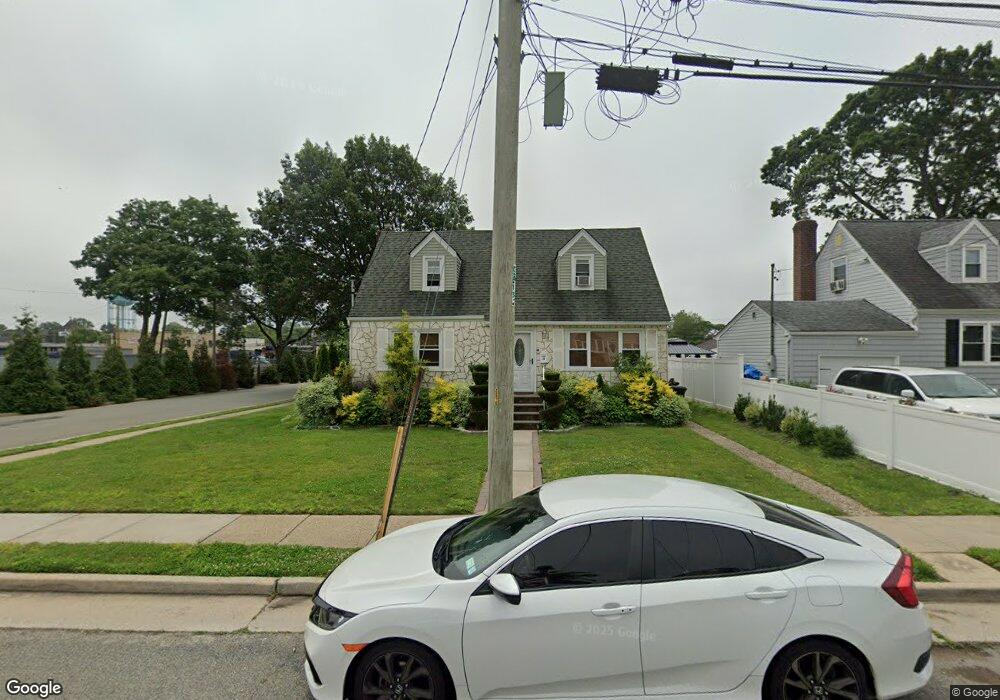
26 Sewell St Hempstead, NY 11550
Estimated Value: $636,461 - $648,000
4
Beds
2
Baths
1,326
Sq Ft
$484/Sq Ft
Est. Value
About This Home
This home is located at 26 Sewell St, Hempstead, NY 11550 and is currently estimated at $642,231, approximately $484 per square foot. 26 Sewell St is a home located in Nassau County with nearby schools including Evergreen Charter School, The Academy Charter School, and Crescent School.
Ownership History
Date
Name
Owned For
Owner Type
Purchase Details
Closed on
Nov 23, 2016
Sold by
Goggin Vivian
Bought by
Howard Eboney and Howard Moshay
Current Estimated Value
Home Financials for this Owner
Home Financials are based on the most recent Mortgage that was taken out on this home.
Original Mortgage
$319,113
Outstanding Balance
$258,667
Interest Rate
3.73%
Mortgage Type
FHA
Estimated Equity
$383,564
Purchase Details
Closed on
Mar 16, 2016
Sold by
Harriman Candace R and Estate Of Ella M Cooper
Bought by
Goggin Vivian
Create a Home Valuation Report for This Property
The Home Valuation Report is an in-depth analysis detailing your home's value as well as a comparison with similar homes in the area
Home Values in the Area
Average Home Value in this Area
Purchase History
| Date | Buyer | Sale Price | Title Company |
|---|---|---|---|
| Howard Eboney | $125,000 | Judicial Title | |
| Goggin Vivian | $100,000 | Titlevest |
Source: Public Records
Mortgage History
| Date | Status | Borrower | Loan Amount |
|---|---|---|---|
| Open | Howard Eboney | $319,113 |
Source: Public Records
Tax History
| Year | Tax Paid | Tax Assessment Tax Assessment Total Assessment is a certain percentage of the fair market value that is determined by local assessors to be the total taxable value of land and additions on the property. | Land | Improvement |
|---|---|---|---|---|
| 2025 | $8,730 | $344 | $127 | $217 |
| 2024 | $885 | $344 | $127 | $217 |
Source: Public Records
Map
Nearby Homes
- 27 Sewell St
- 24 Madison Ave
- 87 Parsons Dr
- 10 Taft Ave
- 24 Harrison Ave
- 42 Sunset Dr
- 24 Parsons Dr
- 14 Parsons Dr
- 16 Laurel Ave
- 37 Maple Ave
- 23 Maple Ave
- 22 Mason St
- 86 Linden Ave
- 140 Long Dr
- 23 Harriman Ave
- 33 Linden Ave
- 3840 Linden Place
- 22 Virginia Ave
- 32 Cathedral Ave Unit 6c
- 22 Mulford Place Unit 2D
Your Personal Tour Guide
Ask me questions while you tour the home.