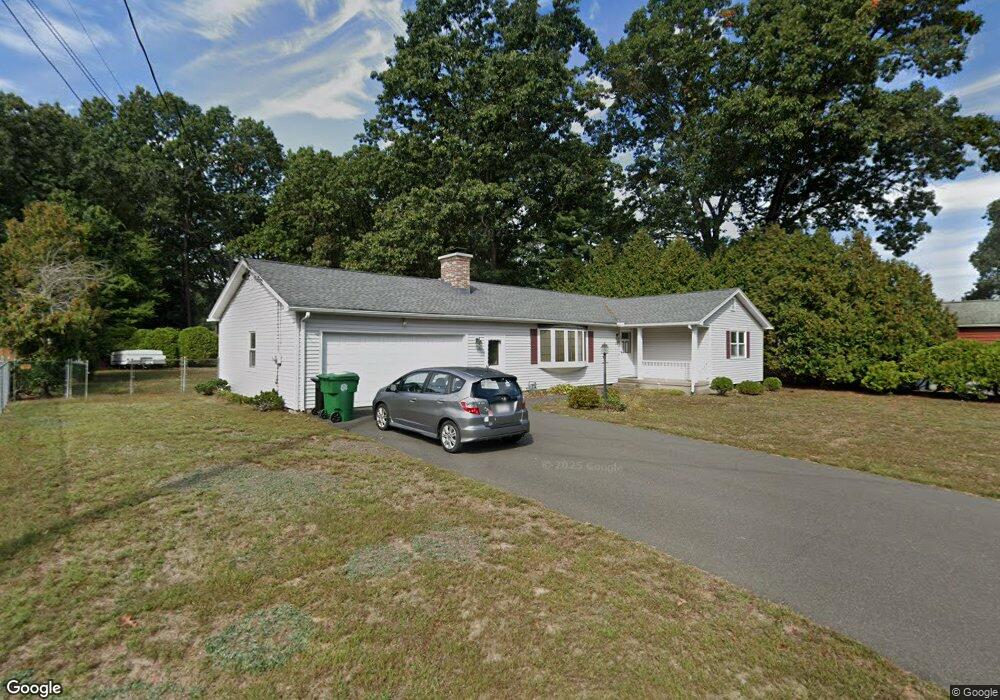
26 Shaban Dr Chicopee, MA 01020
Fairview NeighborhoodEstimated Value: $352,000 - $381,569
3
Beds
2
Baths
1,360
Sq Ft
$267/Sq Ft
Est. Value
About This Home
This home is located at 26 Shaban Dr, Chicopee, MA 01020 and is currently estimated at $363,142, approximately $267 per square foot. 26 Shaban Dr is a home located in Hampden County with nearby schools including Bowie Elementary School, Fairview Middle School, and Chicopee Comprehensive High School.
Ownership History
Date
Name
Owned For
Owner Type
Purchase Details
Closed on
May 26, 2022
Sold by
Gajowski William
Bought by
Gajowski John
Current Estimated Value
Home Financials for this Owner
Home Financials are based on the most recent Mortgage that was taken out on this home.
Original Mortgage
$135,000
Outstanding Balance
$126,794
Interest Rate
5%
Mortgage Type
Purchase Money Mortgage
Estimated Equity
$236,348
Purchase Details
Closed on
Mar 20, 2006
Sold by
Gajowski Louise
Bought by
Gajowski Louise and Gajowski William T
Create a Home Valuation Report for This Property
The Home Valuation Report is an in-depth analysis detailing your home's value as well as a comparison with similar homes in the area
Home Values in the Area
Average Home Value in this Area
Purchase History
We collect this data history from publicly available records. To have your information removed, we recommend requesting removal directly through your county’s website.
| Date | Buyer | Sale Price | Title Company |
|---|---|---|---|
| Gajowski John | $170,000 | None Available | |
| Gajowski Louise | -- | -- | |
| Gajowski Louise A | -- | -- |
Source: Public Records
Mortgage History
We collect this data history from publicly available records. To have your information removed, we recommend requesting removal directly through your county’s website.
| Date | Status | Borrower | Loan Amount |
|---|---|---|---|
| Open | Gajowski John | $135,000 |
Source: Public Records
Tax History
| Year | Tax Paid | Tax Assessment Tax Assessment Total Assessment is a certain percentage of the fair market value that is determined by local assessors to be the total taxable value of land and additions on the property. | Land | Improvement |
|---|---|---|---|---|
| 2025 | $4,806 | $317,000 | $115,000 | $202,000 |
| 2024 | $4,555 | $308,600 | $112,700 | $195,900 |
| 2023 | $4,300 | $283,800 | $102,500 | $181,300 |
| 2022 | $4,093 | $240,900 | $89,100 | $151,800 |
| 2021 | $3,879 | $220,300 | $81,000 | $139,300 |
| 2020 | $3,722 | $213,200 | $83,200 | $130,000 |
| 2019 | $3,660 | $203,800 | $83,200 | $120,600 |
| 2018 | $3,547 | $193,700 | $79,200 | $114,500 |
| 2017 | $3,289 | $190,000 | $72,600 | $117,400 |
| 2016 | $3,294 | $194,800 | $72,600 | $122,200 |
| 2015 | $3,252 | $185,400 | $72,600 | $112,800 |
| 2014 | $1,626 | $185,400 | $72,600 | $112,800 |
Source: Public Records
Map
Nearby Homes
- 81 Mccarthy Ave
- 98 Greenpoint Cir
- 200 Royal St
- 20 Richmond Way
- 33 Guerin St
- 523 James St
- 165 Applewood Dr
- 128 Ann St
- 76 Mitchell Dr
- 79 Beaudry Ave
- 32 Yorktown Ct Unit 32
- 125 Greenwood Terrace
- 68 Honeysuckle Dr
- 72 Honeysuckle Dr
- 125 Lynwood Dr Unit 6201D
- 1760 Westover Rd Unit 1
- 111 Woodcrest Cir
- 14 Hillside Ave
- 6 Center St
- 27 Somerset Rd
Your Personal Tour Guide
Ask me questions while you tour the home.