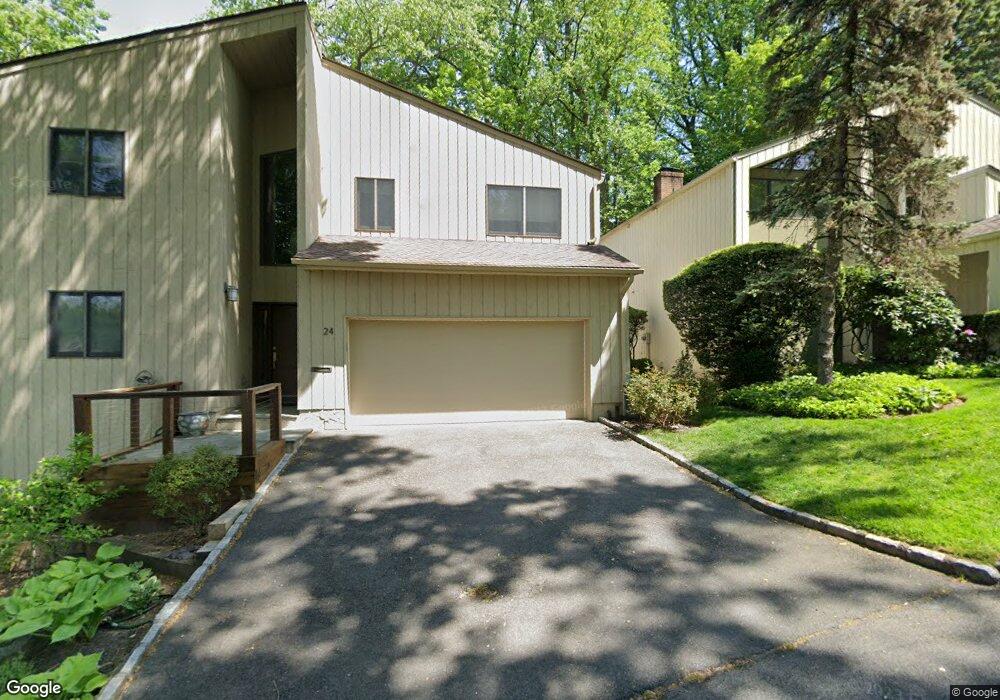
26 Talcott Rd Rye Brook, NY 10573
Estimated Value: $1,151,000 - $1,236,000
4
Beds
3
Baths
2,350
Sq Ft
$514/Sq Ft
Est. Value
About This Home
This home is located at 26 Talcott Rd, Rye Brook, NY 10573 and is currently estimated at $1,207,087, approximately $513 per square foot. 26 Talcott Rd is a home located in Westchester County with nearby schools including Bruno M. Ponterio Ridge Street School, Blind Brook Rye Middle School, and Blind Brook High School.
Ownership History
Date
Name
Owned For
Owner Type
Purchase Details
Closed on
Aug 19, 2005
Sold by
Rubman Mark H and Rubman Annette H
Bought by
George George K and Mathews Jenny
Current Estimated Value
Home Financials for this Owner
Home Financials are based on the most recent Mortgage that was taken out on this home.
Original Mortgage
$490,000
Interest Rate
5.81%
Mortgage Type
Purchase Money Mortgage
Create a Home Valuation Report for This Property
The Home Valuation Report is an in-depth analysis detailing your home's value as well as a comparison with similar homes in the area
Home Values in the Area
Average Home Value in this Area
Purchase History
| Date | Buyer | Sale Price | Title Company |
|---|---|---|---|
| George George K | $612,500 | -- |
Source: Public Records
Mortgage History
| Date | Status | Borrower | Loan Amount |
|---|---|---|---|
| Previous Owner | George George K | $490,000 |
Source: Public Records
Tax History
| Year | Tax Paid | Tax Assessment Tax Assessment Total Assessment is a certain percentage of the fair market value that is determined by local assessors to be the total taxable value of land and additions on the property. | Land | Improvement |
|---|---|---|---|---|
| 2024 | $28,658 | $1,021,500 | $430,400 | $591,100 |
| 2023 | $25,311 | $991,700 | $409,900 | $581,800 |
| 2022 | $24,645 | $926,800 | $409,900 | $516,900 |
| 2021 | $24,881 | $842,500 | $409,900 | $432,600 |
| 2020 | $20,285 | $859,700 | $409,900 | $449,800 |
| 2019 | $23,585 | $846,100 | $478,600 | $367,500 |
| 2018 | $15,007 | $846,100 | $477,400 | $368,700 |
| 2017 | $3,723 | $842,000 | $473,300 | $368,700 |
| 2016 | $19,903 | $879,100 | $461,000 | $418,100 |
| 2015 | -- | $839,800 | $447,300 | $392,500 |
| 2014 | -- | $762,000 | $425,900 | $336,100 |
| 2013 | -- | $621,200 | $325,200 | $296,000 |
Source: Public Records
Map
Nearby Homes
- 8 Talcott Rd
- 10 Carlton Ln
- 38 Lincoln Ave
- 4 Pine Ridge Rd
- 15 Elm Hill Dr
- 54 Lincoln Ave
- 11 Jennifer Ln
- 6 Old Oak Rd
- 345 Betsy Brown Rd
- 12 Old Oak Rd
- 80 Valley Terrace
- 2 Alyssa Ln
- 14 Eagles Bluff
- 30 Argyle Rd
- 9 Valley Terrace
- 39 Avon Cir Unit A
- 57 Haines Blvd
- 11 Meadowlark Rd
- 10 Meadow Ln
- 21 Lincoln Ln
Your Personal Tour Guide
Ask me questions while you tour the home.