26 Vera St Warwick, RI 02886
Greenwood NeighborhoodEstimated Value: $373,000 - $385,000
About This Home
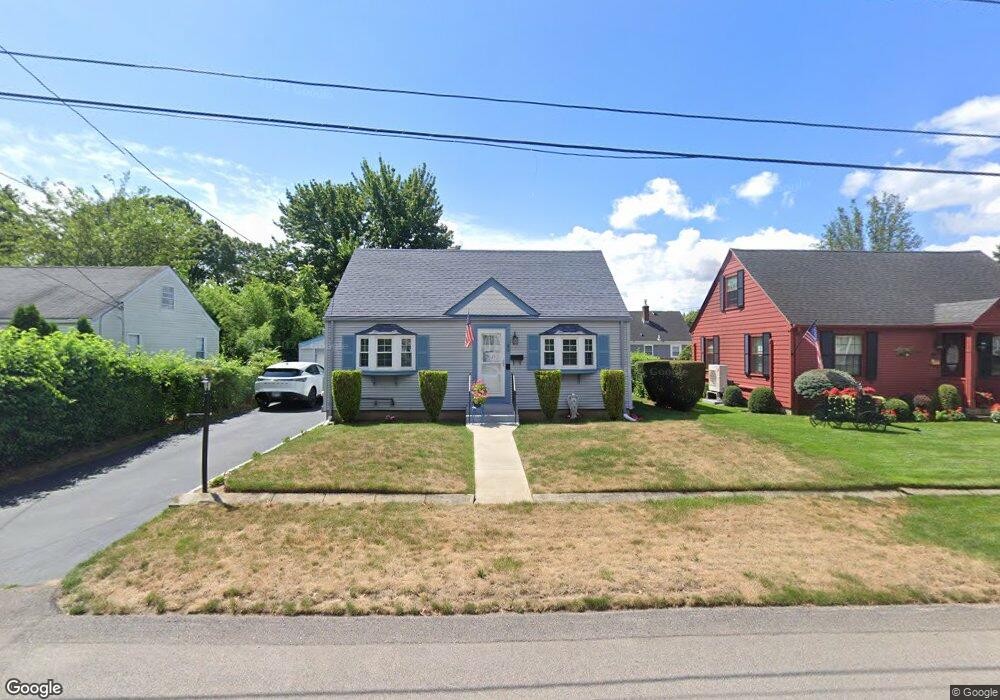
This home is located at 26 Vera St, Warwick, RI 02886 and is currently estimated at $377,337, approximately $361 per square foot. 26 Vera St is a home located in Kent County with nearby schools including St Rose Of Lima School.
Ownership History
We collect this data history from publicly available records. To have your information removed, we recommend requesting removal directly through your county’s website.
Purchase Details
Purchase Details
Home Financials for this Owner
Home Financials are based on the most recent Mortgage that was taken out on this home.Home Values in the Area
Average Home Value in this Area
Purchase History
We collect this data history from publicly available records. To have your information removed, we recommend requesting removal directly through your county’s website.
| Date | Buyer | Sale Price | Title Company |
|---|---|---|---|
| -- | None Available | ||
| $93,500 | -- | ||
| $93,500 | -- |
Mortgage History
We collect this data history from publicly available records. To have your information removed, we recommend requesting removal directly through your county’s website.
| Date | Status | Borrower | Loan Amount |
|---|---|---|---|
| Previous Owner | $82,900 |
Tax History
We collect this data history from publicly available records. To have your information removed, we recommend requesting removal directly through your county’s website.
| Year | Tax Paid | Tax Assessment Tax Assessment Total Assessment is a certain percentage of the fair market value that is determined by local assessors to be the total taxable value of land and additions on the property. | Land | Improvement |
|---|---|---|---|---|
| 2025 | $4,034 | $317,600 | $101,200 | $216,400 |
| 2024 | $3,486 | $240,900 | $76,400 | $164,500 |
| 2023 | $3,418 | $240,900 | $76,400 | $164,500 |
| 2022 | $3,326 | $177,600 | $53,800 | $123,800 |
| 2021 | $3,326 | $177,600 | $53,800 | $123,800 |
| 2020 | $3,326 | $177,600 | $53,800 | $123,800 |
| 2019 | $3,326 | $177,600 | $53,800 | $123,800 |
| 2018 | $2,835 | $136,300 | $48,700 | $87,600 |
| 2017 | $2,759 | $136,300 | $48,700 | $87,600 |
| 2016 | $2,759 | $136,300 | $48,700 | $87,600 |
| 2015 | $2,639 | $127,200 | $51,800 | $75,400 |
| 2014 | $2,552 | $127,200 | $51,800 | $75,400 |
| 2013 | $2,517 | $127,200 | $51,800 | $75,400 |
Map
- 54 Carpenter St
- 199 Main Ave
- 7 Parkway Dr
- 59 Red Maple Ln
- 66 Child Ln
- 48 Child Ln
- 37 Child Ln
- 4 Wicks Ct
- 23 Perkins St
- 16 Arrow Ave
- 107 Keystone Dr Unit 116
- 14 Stone Ave
- 74 Stephens Ave
- 48 Wesleyan Ave
- 70 Turner St Unit A-3
- 70 Turner St Unit E-8
- 70 Turner St Unit D-2
- 143 Endicott Dr
- 191 Long View Dr
- 211 Pinnery Ave
Ask me questions while you tour the home.