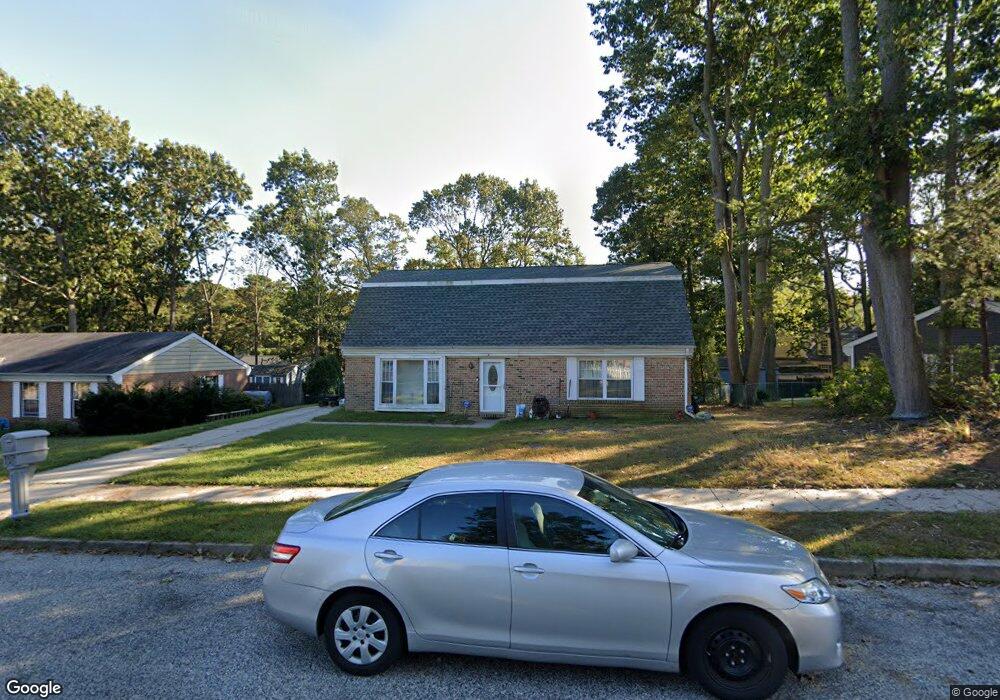
26 Windmill Dr Clementon, NJ 08021
Estimated Value: $314,000 - $358,554
Studio
--
Bath
1,814
Sq Ft
$186/Sq Ft
Est. Value
About This Home
This home is located at 26 Windmill Dr, Clementon, NJ 08021 and is currently estimated at $337,139, approximately $185 per square foot. 26 Windmill Dr is a home located in Camden County with nearby schools including Blackwood Elementary School, Charles W. Lewis Middle School, and Highland Regional High School.
Ownership History
Date
Name
Owned For
Owner Type
Purchase Details
Closed on
Dec 4, 2009
Sold by
Swope Geraldine and Fisher Steven V
Bought by
Fisher Steven and Fisher Geraldine
Current Estimated Value
Home Financials for this Owner
Home Financials are based on the most recent Mortgage that was taken out on this home.
Original Mortgage
$162,622
Interest Rate
5.05%
Mortgage Type
VA
Purchase Details
Closed on
Oct 10, 2001
Sold by
Fricks Ernest E
Bought by
Fisher Steven V and Swope Geraldine
Home Financials for this Owner
Home Financials are based on the most recent Mortgage that was taken out on this home.
Original Mortgage
$91,425
Interest Rate
6.82%
Create a Home Valuation Report for This Property
The Home Valuation Report is an in-depth analysis detailing your home's value as well as a comparison with similar homes in the area
Home Values in the Area
Average Home Value in this Area
Purchase History
| Date | Buyer | Sale Price | Title Company |
|---|---|---|---|
| Fisher Steven | -- | -- | |
| Fisher Steven V | $121,000 | -- |
Source: Public Records
Mortgage History
| Date | Status | Borrower | Loan Amount |
|---|---|---|---|
| Previous Owner | Fisher Steven | $162,622 | |
| Previous Owner | Fisher Steven V | $91,425 |
Source: Public Records
Tax History
| Year | Tax Paid | Tax Assessment Tax Assessment Total Assessment is a certain percentage of the fair market value that is determined by local assessors to be the total taxable value of land and additions on the property. | Land | Improvement |
|---|---|---|---|---|
| 2025 | $8,265 | $190,000 | $65,000 | $125,000 |
| 2024 | $7,889 | $190,000 | $65,000 | $125,000 |
| 2023 | $7,889 | $190,000 | $65,000 | $125,000 |
| 2022 | $7,839 | $190,000 | $65,000 | $125,000 |
| 2021 | $7,417 | $190,000 | $65,000 | $125,000 |
| 2020 | $7,661 | $190,000 | $65,000 | $125,000 |
| 2019 | $7,503 | $190,000 | $65,000 | $125,000 |
| 2018 | $7,475 | $190,000 | $65,000 | $125,000 |
| 2017 | $7,233 | $190,000 | $65,000 | $125,000 |
| 2016 | $7,078 | $190,000 | $65,000 | $125,000 |
| 2015 | $6,572 | $190,000 | $65,000 | $125,000 |
| 2014 | $6,528 | $190,000 | $65,000 | $125,000 |
Source: Public Records
Map
Nearby Homes
Your Personal Tour Guide
Ask me questions while you tour the home.