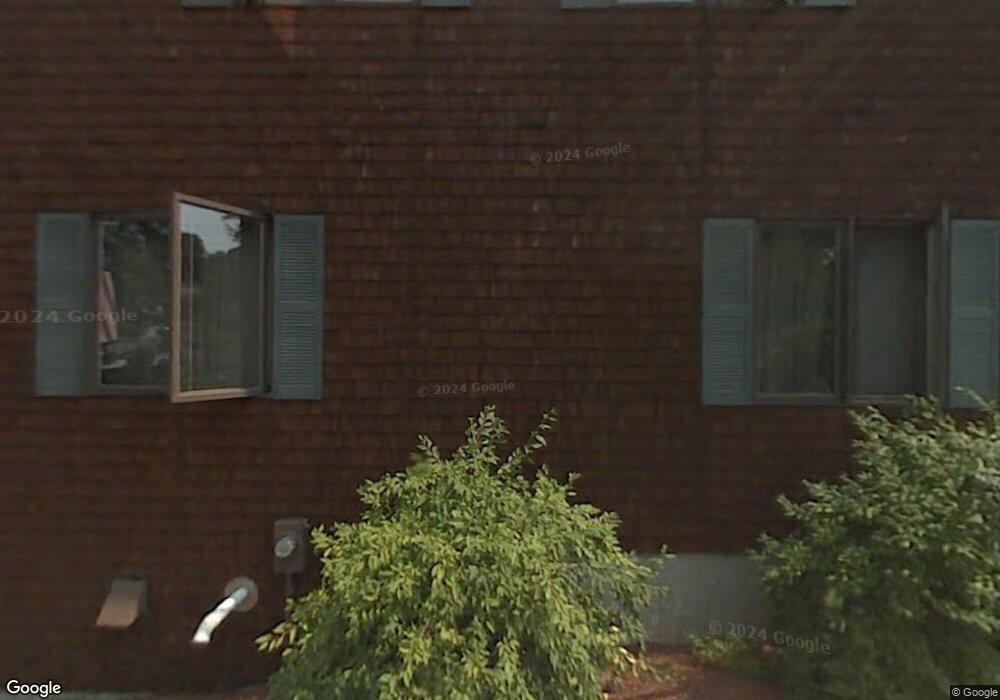
260 Main St Clinton, MA 01510
Estimated Value: $550,000 - $701,000
3
Beds
3
Baths
3,352
Sq Ft
$188/Sq Ft
Est. Value
About This Home
This home is located at 260 Main St, Clinton, MA 01510 and is currently estimated at $628,753, approximately $187 per square foot. 260 Main St is a home located in Worcester County with nearby schools including Clinton Elementary School, Clinton Senior High School, and Clinton Middle School.
Ownership History
Date
Name
Owned For
Owner Type
Purchase Details
Closed on
Apr 14, 2026
Sold by
Pender Anique
Bought by
Moreira Manuel
Current Estimated Value
Purchase Details
Closed on
Jun 24, 2024
Sold by
Pender Anique and Suhr Hektor H
Bought by
Pender Anique
Purchase Details
Closed on
Sep 30, 2019
Sold by
Pender Peter M and Pender Claire
Bought by
Suhr Ragnar H and Suhr Anique C
Home Financials for this Owner
Home Financials are based on the most recent Mortgage that was taken out on this home.
Original Mortgage
$335,000
Interest Rate
3.6%
Mortgage Type
New Conventional
Create a Home Valuation Report for This Property
The Home Valuation Report is an in-depth analysis detailing your home's value as well as a comparison with similar homes in the area
Home Values in the Area
Average Home Value in this Area
Purchase History
| Date | Buyer | Sale Price | Title Company |
|---|---|---|---|
| Moreira Manuel | -- | -- | |
| Pender Anique | $102,670 | None Available | |
| Suhr Ragnar H | $418,750 | -- |
Source: Public Records
Mortgage History
| Date | Status | Borrower | Loan Amount |
|---|---|---|---|
| Previous Owner | Suhr Ragnar H | $335,000 |
Source: Public Records
Tax History
| Year | Tax Paid | Tax Assessment Tax Assessment Total Assessment is a certain percentage of the fair market value that is determined by local assessors to be the total taxable value of land and additions on the property. | Land | Improvement |
|---|---|---|---|---|
| 2025 | $7,675 | $577,100 | $164,200 | $412,900 |
| 2024 | $7,897 | $601,000 | $164,200 | $436,800 |
| 2023 | $7,546 | $564,400 | $149,300 | $415,100 |
| 2022 | $7,594 | $509,300 | $150,100 | $359,200 |
| 2021 | $6,932 | $434,900 | $147,700 | $287,200 |
| 2020 | $6,851 | $442,300 | $147,700 | $294,600 |
| 2019 | $6,844 | $429,600 | $143,400 | $286,200 |
| 2018 | $6,561 | $386,400 | $116,800 | $269,600 |
| 2017 | $6,483 | $366,900 | $116,800 | $250,100 |
| 2016 | $6,440 | $372,900 | $116,800 | $256,100 |
| 2015 | $5,664 | $340,000 | $117,000 | $223,000 |
| 2014 | $5,491 | $340,000 | $117,000 | $223,000 |
Source: Public Records
Map
Nearby Homes
- 23 Winthrop St
- 20 S Main St
- 125 Grove St
- 9 Dervin Place
- 40 Nashua St Unit 3
- 129 High St
- 55 Sterling St Unit 306
- 55 Sterling St Unit 314
- 55 Sterling St Unit 103
- 55 Sterling St Unit 208
- 55 Sterling St Unit 305
- 719 Main St
- 57 Clark St
- 454 Wilson St
- 200 Greeley St
- 12 Cole Farm Rd
- 861 Main St
- 508 High St
- 9 Hamilton St
- 354356 Water St
Your Personal Tour Guide
Ask me questions while you tour the home.