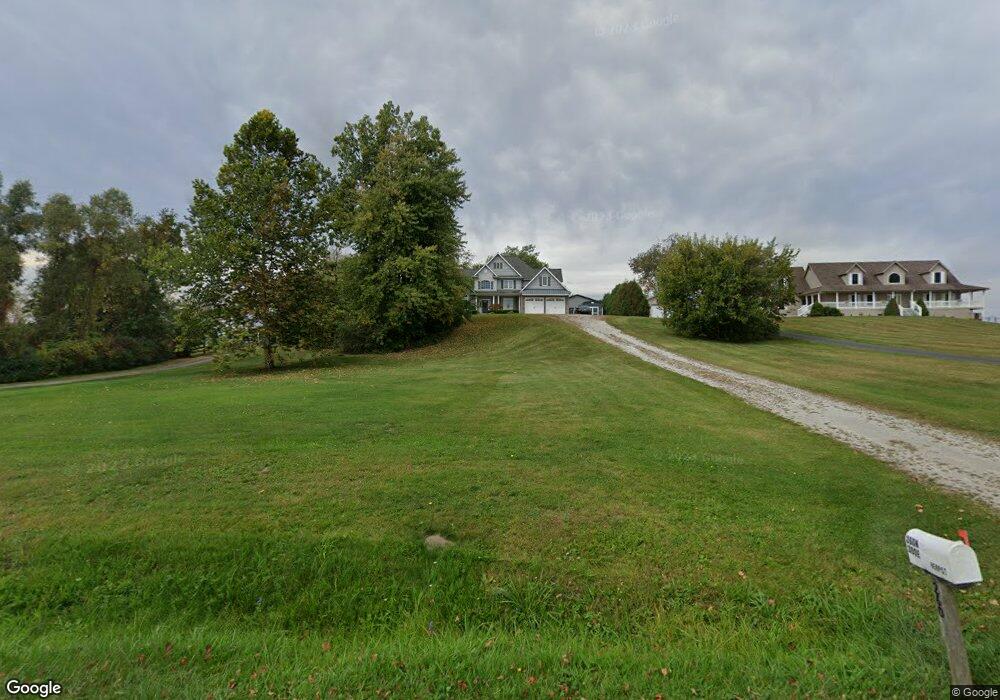
260 N 300 E Lagrange, IN 46761
Estimated Value: $565,000 - $630,000
5
Beds
4
Baths
5,446
Sq Ft
$109/Sq Ft
Est. Value
About This Home
This home is located at 260 N 300 E, Lagrange, IN 46761 and is currently estimated at $591,819, approximately $108 per square foot. 260 N 300 E is a home located in LaGrange County with nearby schools including Lakeland Jr/Sr High School, East Yoder School, and Meadowbrook School.
Ownership History
Date
Name
Owned For
Owner Type
Purchase Details
Closed on
May 24, 2021
Sold by
Titus Samuel Lee
Bought by
Herpst Joseph
Current Estimated Value
Home Financials for this Owner
Home Financials are based on the most recent Mortgage that was taken out on this home.
Interest Rate
3%
Purchase Details
Closed on
Sep 11, 2017
Sold by
Frost and Noel
Bought by
Titus Samuel Lee and Titus Amber Leigh
Home Financials for this Owner
Home Financials are based on the most recent Mortgage that was taken out on this home.
Original Mortgage
$272,690
Interest Rate
3.93%
Mortgage Type
Construction
Create a Home Valuation Report for This Property
The Home Valuation Report is an in-depth analysis detailing your home's value as well as a comparison with similar homes in the area
Purchase History
| Date | Buyer | Sale Price | Title Company |
|---|---|---|---|
| Herpst Joseph | $445,000 | -- | |
| Titus Samuel Lee | $275,416 | Attorney Only |
Source: Public Records
Mortgage History
| Date | Status | Borrower | Loan Amount |
|---|---|---|---|
| Closed | Herpst Joseph | -- | |
| Previous Owner | Titus Samuel Lee | $272,690 |
Source: Public Records
Tax History
| Year | Tax Paid | Tax Assessment Tax Assessment Total Assessment is a certain percentage of the fair market value that is determined by local assessors to be the total taxable value of land and additions on the property. | Land | Improvement |
|---|---|---|---|---|
| 2025 | $1,998 | $532,300 | $33,600 | $498,700 |
| 2024 | $1,998 | $515,100 | $33,600 | $481,500 |
| 2023 | $1,630 | $459,100 | $32,100 | $427,000 |
| 2022 | $1,858 | $426,400 | $28,400 | $398,000 |
| 2021 | $1,430 | $358,000 | $25,800 | $332,200 |
| 2020 | $1,474 | $342,300 | $25,600 | $316,700 |
| 2019 | $1,376 | $317,300 | $25,600 | $291,700 |
| 2018 | $1,496 | $307,500 | $25,600 | $281,900 |
| 2017 | $1,741 | $343,600 | $25,500 | $318,100 |
| 2016 | $1,686 | $335,300 | $24,100 | $311,200 |
| 2014 | $1,460 | $300,500 | $24,100 | $276,400 |
| 2013 | $1,460 | $303,500 | $24,100 | $279,400 |
Source: Public Records
Map
Nearby Homes
- 1400 N 200 E
- 503 E Michigan St
- 508 E Spring St
- 737 N Canal St
- 314 E Michigan St
- 1055 S 495 E
- 1550 N 080 E
- 207 S Poplar St
- 109 E Factory St
- 5120 E 100 S
- 307 N Detroit St
- 202 W Central Ave
- 1630 S 485 E
- 604 Vine St
- 217-219 Church St
- 2200 S State Road 9 Hwy
- 2200 S 460 E
- 920 N 00ew
- 2375 S 460 E
- 2140 S 500 E
Your Personal Tour Guide
Ask me questions while you tour the home.