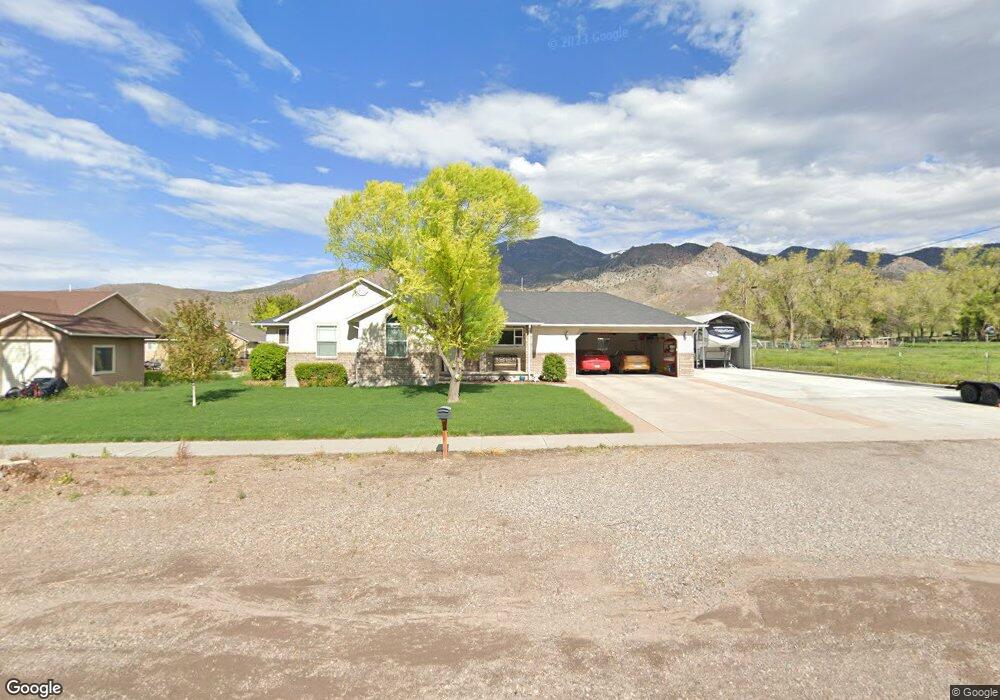
260 N 300 E Monroe, UT 84754
Monroe NeighborhoodEstimated Value: $511,659 - $655,000
3
Beds
3
Baths
2,992
Sq Ft
$199/Sq Ft
Est. Value
About This Home
This home is located at 260 N 300 E, Monroe, UT 84754 and is currently estimated at $596,665, approximately $199 per square foot. 260 N 300 E is a home located in Sevier County with nearby schools including Monroe School, South Sevier Middle School, and South Sevier High School.
Ownership History
Date
Name
Owned For
Owner Type
Purchase Details
Closed on
Feb 14, 2022
Sold by
Scott Brady
Bought by
Cepheus Trust
Current Estimated Value
Purchase Details
Closed on
Dec 10, 2016
Sold by
Brady Scott and Brady Shalice
Bought by
Forbush M Don and Cepheus Trust
Purchase Details
Closed on
Nov 22, 2016
Sold by
Cepheus Trust
Bought by
Brady Scott and Brady Shalice
Create a Home Valuation Report for This Property
The Home Valuation Report is an in-depth analysis detailing your home's value as well as a comparison with similar homes in the area
Home Values in the Area
Average Home Value in this Area
Purchase History
We collect this data history from publicly available records. To have your information removed, we recommend requesting removal directly through your county’s website.
| Date | Buyer | Sale Price | Title Company |
|---|---|---|---|
| Cepheus Trust | -- | None Listed On Document | |
| Forbush M Don | -- | None Available | |
| Brady Scott | -- | New Title Company Name |
Source: Public Records
Tax History
| Year | Tax Paid | Tax Assessment Tax Assessment Total Assessment is a certain percentage of the fair market value that is determined by local assessors to be the total taxable value of land and additions on the property. | Land | Improvement |
|---|---|---|---|---|
| 2025 | $2,706 | $300,447 | $41,154 | $259,293 |
| 2024 | $2,706 | $303,946 | $37,997 | $265,949 |
| 2023 | $2,784 | $303,141 | $37,053 | $266,088 |
| 2022 | $2,288 | $216,835 | $29,252 | $187,583 |
| 2021 | $2,453 | $192,314 | $21,183 | $171,131 |
| 2020 | $2,200 | $161,665 | $20,174 | $141,491 |
| 2019 | $2,035 | $157,110 | $18,160 | $138,950 |
| 2018 | $2,073 | $142,390 | $16,140 | $126,250 |
| 2017 | $1,895 | $135,130 | $17,350 | $117,780 |
| 2016 | $1,459 | $134,690 | $0 | $0 |
| 2015 | $1,459 | $134,690 | $0 | $0 |
| 2014 | $1,459 | $134,690 | $0 | $0 |
Source: Public Records
Map
Nearby Homes
Your Personal Tour Guide
Ask me questions while you tour the home.