J
Seller's Agent in 2023
Jerry Rose
KW Empower
(609) 500-7050
1 in this area
14 Total Sales


Estimated Value: $355,000 - $408,000
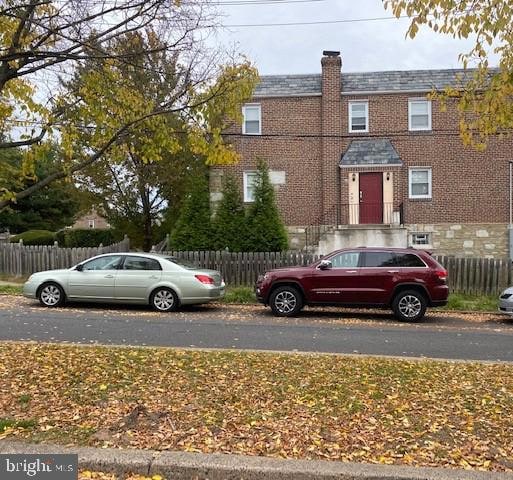
Welcome to 261 E. Fariston Drive! Simply put this multi-family property speaks for itself. The entire property has been meticulously rehabbed three ago and all the boxes are checked. Utilities are separate. Each unit is under lease and each unit gets $1,200 per month. The tenants are on month to month leases and two-bedroom apartments in the area are as high as $1,450 per month. Both first and second units have new forced air heating and AC units. The basement owner suite has new forced air as well. All the boxes are checked, from top to bottom. The owner has self-managed the building with pride of ownership at the highest level. The property is a must see. Rental License is active and Lead Based Certs are updated (2021). Please make your appointment today!
We collect this data history from publicly available records. To have your information removed, we recommend requesting removal directly through your county’s website.
We collect this data history from publicly available records. To have your information removed, we recommend requesting removal directly through your county’s website.
| Date | Buyer | Sale Price | Title Company |
|---|---|---|---|
| $330,000 | -- | ||
| $135,000 | Cantral Montgomery Abstract | ||
| -- | None Available | ||
| $95,000 | Land Title Building | ||
| $102,000 | -- |
We collect this data history from publicly available records. To have your information removed, we recommend requesting removal directly through your county’s website.
| Date | Status | Borrower | Loan Amount |
|---|---|---|---|
| Open | $313,500 | ||
| Previous Owner | $185,616 | ||
| Previous Owner | $101,150 | ||
| Closed | $16,500 |
We collect this data history from publicly available records. To have your information removed, we recommend requesting removal directly through your county’s website.
| Date | Event | Price | List to Sale | Price per Sq Ft | Prior Sale |
|---|---|---|---|---|---|
| 02/28/2023 02/28/23 | Sold | $330,000 | -2.9% | $206 / Sq Ft | |
| 02/05/2023 02/05/23 | Pending | -- | -- | -- | |
| 01/13/2023 01/13/23 | Price Changed | $339,900 | -1.5% | $212 / Sq Ft | |
| 01/02/2023 01/02/23 | Price Changed | $345,000 | -4.1% | $216 / Sq Ft | |
| 10/25/2022 10/25/22 | For Sale | $359,900 | +166.6% | $225 / Sq Ft | |
| 12/27/2017 12/27/17 | Sold | $135,000 | 0.0% | $84 / Sq Ft | View Prior Sale |
| 09/05/2017 09/05/17 | Pending | -- | -- | -- | |
| 09/05/2017 09/05/17 | Off Market | $135,000 | -- | -- | |
| 08/24/2017 08/24/17 | For Sale | $115,000 | -- | $72 / Sq Ft |
We collect this data history from publicly available records. To have your information removed, we recommend requesting removal directly through your county’s website.
| Year | Tax Paid | Tax Assessment Tax Assessment Total Assessment is a certain percentage of the fair market value that is determined by local assessors to be the total taxable value of land and additions on the property. | Land | Improvement |
|---|---|---|---|---|
| 2026 | $4,619 | $330,000 | $66,000 | $264,000 |
| 2025 | $1,932 | $330,000 | $66,000 | $264,000 |
| 2024 | $1,932 | $330,000 | $66,000 | $264,000 |
| 2023 | $1,932 | $138,000 | $27,600 | $110,400 |
| 2022 | $1,568 | $138,000 | $27,600 | $110,400 |
| 2021 | $1,568 | $0 | $0 | $0 |
| 2020 | $1,568 | $112,000 | $18,479 | $93,521 |
| 2019 | $2,357 | $0 | $0 | $0 |
| 2018 | $2,472 | $0 | $0 | $0 |
| 2017 | $2,472 | $0 | $0 | $0 |
| 2016 | $2,472 | $0 | $0 | $0 |
| 2015 | $2,366 | $0 | $0 | $0 |
| 2014 | -- | $176,600 | $21,642 | $154,958 |
| 2012 | -- | $22,624 | $3,376 | $19,248 |
J
Seller's Agent in 2023
Jerry Rose
KW Empower
(609) 500-7050
1 in this area
14 Total Sales

Buyer's Agent in 2023
Christine Kennedy
Keller Williams Main Line
(267) 808-8962
1 in this area
24 Total Sales
Seller's Agent in 2017
Alvaro Ronderos
Independence Real Estate Sales LLC
(484) 919-4152
90 Total Sales
Source: Bright MLS
MLS Number: PAPH2172648
APN: 611384900
Disclaimer: Certain information contained herein is derived from information provided by parties other than Homes.com. All information provided is deemed reliable, but is not guaranteed to be accurate and should be independently verified.
![]() The data relating to real estate for sale on this website appears in part through the BRIGHT Internet Data Exchange program, a voluntary cooperative exchange of property listing data between licensed real estate brokerage firms, and is provided by BRIGHT through a licensing agreement.
The data relating to real estate for sale on this website appears in part through the BRIGHT Internet Data Exchange program, a voluntary cooperative exchange of property listing data between licensed real estate brokerage firms, and is provided by BRIGHT through a licensing agreement.
Listing information is from various brokers who participate in the Bright MLS IDX program and not all listings may be visible on the site.
The property information being provided on or through the website is for the personal, non-commercial use of consumers and such information may not be used for any purpose other than to identify prospective properties consumers may be interested in purchasing.
Some properties which appear for sale on the website may no longer be available because they are for instance, under contract, sold or are no longer being offered for sale.
Property information displayed is deemed reliable but is not guaranteed.
Copyright 2026 Bright MLS, Inc.
Ask me questions while you tour the home.