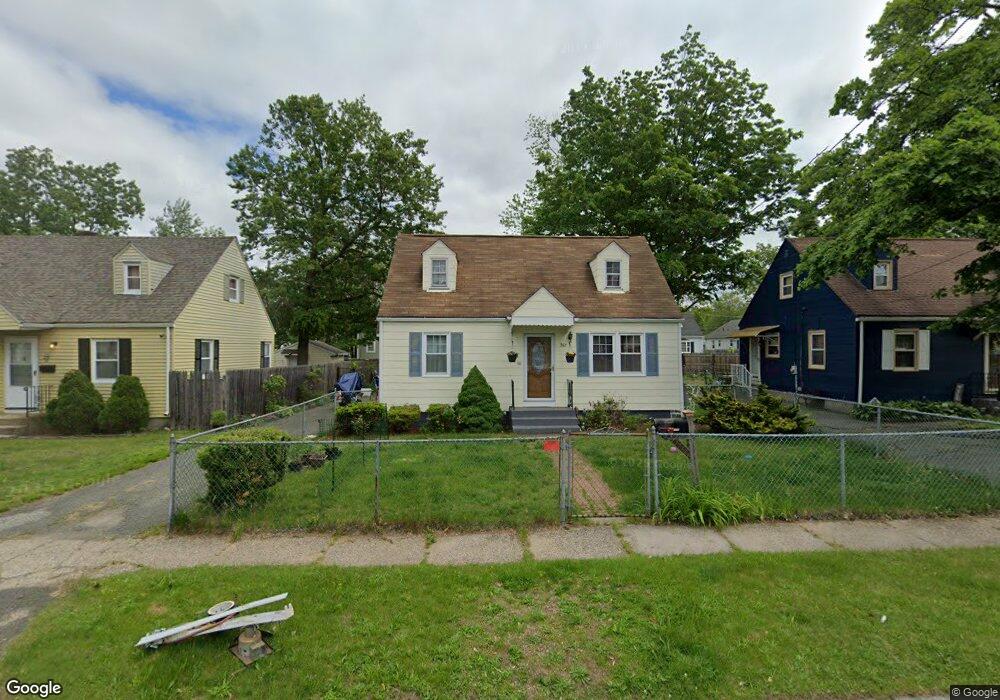
261 Rosewell St Springfield, MA 01109
Pine Point NeighborhoodEstimated Value: $294,000 - $308,000
3
Beds
2
Baths
1,338
Sq Ft
$224/Sq Ft
Est. Value
About This Home
This home is located at 261 Rosewell St, Springfield, MA 01109 and is currently estimated at $299,935, approximately $224 per square foot. 261 Rosewell St is a home located in Hampden County with nearby schools including Frank H. Freedman School, John J Duggan Middle, and Springfield Central High School.
Ownership History
Date
Name
Owned For
Owner Type
Purchase Details
Closed on
Nov 5, 2019
Sold by
Clarke Matthew T
Bought by
Clarke Dolly A
Current Estimated Value
Home Financials for this Owner
Home Financials are based on the most recent Mortgage that was taken out on this home.
Original Mortgage
$151,098
Outstanding Balance
$132,634
Interest Rate
3.49%
Mortgage Type
FHA
Estimated Equity
$167,301
Purchase Details
Closed on
Apr 10, 2014
Sold by
Clarke Matthew T and Clarke Diana R
Bought by
Clarke Matthew T
Purchase Details
Closed on
Apr 1, 1991
Sold by
Clarke Theodore F and Clarke Agnes M
Bought by
Clarke Matthew T and Clarke Diana R
Create a Home Valuation Report for This Property
The Home Valuation Report is an in-depth analysis detailing your home's value as well as a comparison with similar homes in the area
Home Values in the Area
Average Home Value in this Area
Purchase History
| Date | Buyer | Sale Price | Title Company |
|---|---|---|---|
| Clarke Dolly A | $165,000 | -- | |
| Clarke Matthew T | $870 | -- | |
| Clarke Matthew T | $65,535 | -- |
Source: Public Records
Mortgage History
| Date | Status | Borrower | Loan Amount |
|---|---|---|---|
| Open | Clarke Dolly A | $151,098 | |
| Previous Owner | Clarke Matthew T | $66,000 |
Source: Public Records
Tax History
| Year | Tax Paid | Tax Assessment Tax Assessment Total Assessment is a certain percentage of the fair market value that is determined by local assessors to be the total taxable value of land and additions on the property. | Land | Improvement |
|---|---|---|---|---|
| 2025 | $3,773 | $240,600 | $39,500 | $201,100 |
| 2024 | $3,842 | $239,200 | $32,900 | $206,300 |
| 2023 | $3,807 | $223,300 | $29,900 | $193,400 |
| 2022 | $3,147 | $167,200 | $28,000 | $139,200 |
| 2021 | $2,731 | $144,500 | $25,400 | $119,100 |
| 2020 | $2,717 | $139,100 | $25,400 | $113,700 |
| 2019 | $2,427 | $123,300 | $25,400 | $97,900 |
| 2018 | $2,542 | $127,800 | $25,400 | $102,400 |
| 2017 | $2,542 | $129,300 | $23,500 | $105,800 |
| 2016 | $2,178 | $110,800 | $23,500 | $87,300 |
| 2015 | $2,113 | $107,400 | $23,500 | $83,900 |
Source: Public Records
Map
Nearby Homes
Your Personal Tour Guide
Ask me questions while you tour the home.