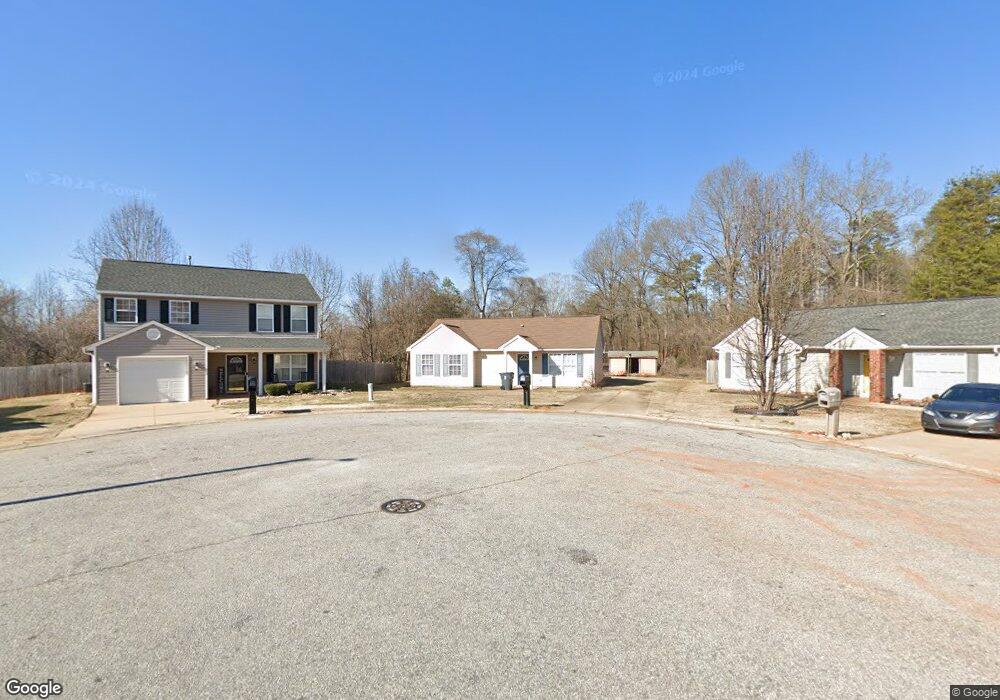
261 Spring St Duncan, SC 29334
Estimated Value: $167,000 - $210,000
3
Beds
2
Baths
1,148
Sq Ft
$173/Sq Ft
Est. Value
About This Home
This home is located at 261 Spring St, Duncan, SC 29334 and is currently estimated at $198,094, approximately $172 per square foot. 261 Spring St is a home located in Spartanburg County with nearby schools including Duncan Elementary School, Byrnes Freshman Academy, and Beech Springs Intermediate School.
Ownership History
Date
Name
Owned For
Owner Type
Purchase Details
Closed on
Apr 20, 2007
Sold by
Brown Kent and Brown Ashland
Bought by
Leonhardt Amanda L
Current Estimated Value
Home Financials for this Owner
Home Financials are based on the most recent Mortgage that was taken out on this home.
Original Mortgage
$2,000
Interest Rate
6.1%
Mortgage Type
Stand Alone Second
Purchase Details
Closed on
Jun 6, 2003
Sold by
Emc Mortgage
Bought by
Brown Kent and Brown Ashland
Purchase Details
Closed on
May 16, 2002
Sold by
Deweese Kacey L
Bought by
Emc Mtg
Create a Home Valuation Report for This Property
The Home Valuation Report is an in-depth analysis detailing your home's value as well as a comparison with similar homes in the area
Home Values in the Area
Average Home Value in this Area
Purchase History
| Date | Buyer | Sale Price | Title Company |
|---|---|---|---|
| Leonhardt Amanda L | $89,900 | None Available | |
| Brown Kent | $60,000 | -- | |
| Emc Mtg | $69,942 | -- |
Source: Public Records
Mortgage History
| Date | Status | Borrower | Loan Amount |
|---|---|---|---|
| Closed | Leonhardt Amanda L | $2,000 | |
| Open | Leonhardt Amanda L | $87,203 |
Source: Public Records
Tax History
| Year | Tax Paid | Tax Assessment Tax Assessment Total Assessment is a certain percentage of the fair market value that is determined by local assessors to be the total taxable value of land and additions on the property. | Land | Improvement |
|---|---|---|---|---|
| 2022 | $873 | $3,454 | $835 | $2,619 |
| 2021 | $853 | $3,454 | $835 | $2,619 |
| 2020 | $838 | $3,454 | $835 | $2,619 |
| 2019 | $831 | $3,454 | $835 | $2,619 |
| 2018 | $792 | $3,454 | $835 | $2,619 |
| 2017 | $713 | $3,004 | $480 | $2,524 |
| 2016 | $691 | $3,004 | $480 | $2,524 |
| 2015 | $676 | $3,004 | $480 | $2,524 |
| 2014 | $669 | $3,004 | $480 | $2,524 |
Source: Public Records
Map
Nearby Homes
- 101 Gap Creek Rd
- 198 Spring St
- 123 Sunny Ray Dr
- 108 Piedmont St
- 31 Campbell St
- 11 Campbell St
- 381 Gap Creek Rd
- 101 Parker St
- 114 N Moore St
- 148 N Church St
- 793 Silver Pines Ln
- 709 Silver Pines Ln
- 289 Lavinia Cir
- 297 Lavinia Cir
- 170 Spartanburg Rd
- 0 Robinson Rd Unit 318992
- 116 Johnson St
- 920 Ravenfield Dr
- 180 Lavinia Cir
- 135 Lavinia Cir
Your Personal Tour Guide
Ask me questions while you tour the home.