Estimated Value: $107,000 - $171,000
2
Beds
2
Baths
945
Sq Ft
$144/Sq Ft
Est. Value
About This Home
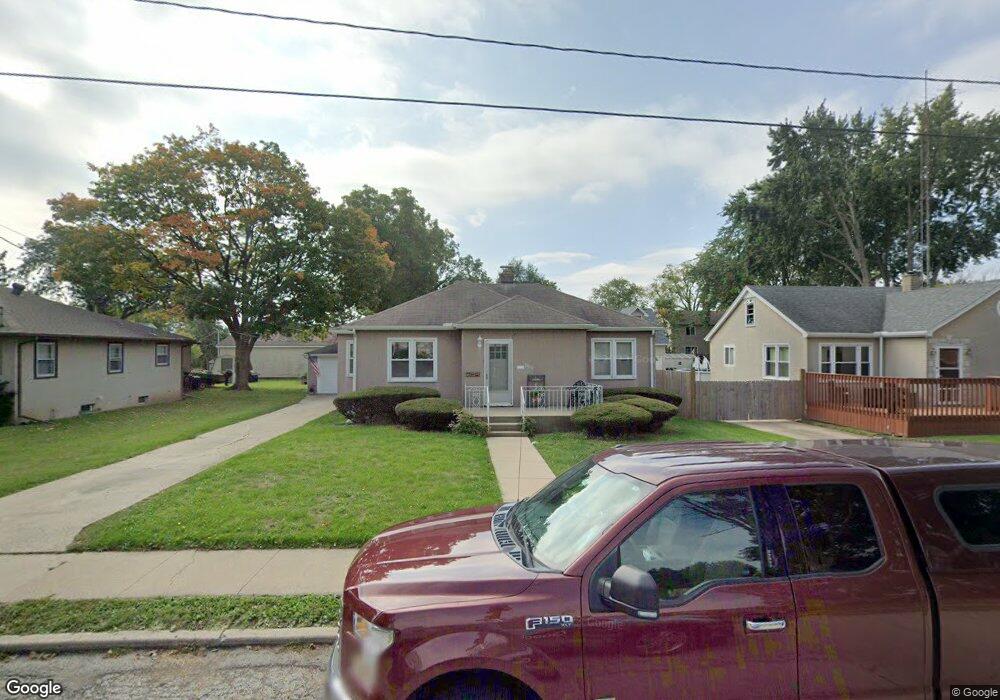
This home is located at 2610 2nd St, Peru, IL 61354 and is currently estimated at $135,835, approximately $143 per square foot. 2610 2nd St is a home located in LaSalle County with nearby schools including Northview Elementary School, Parkside Middle School, and Peru Catholic School.
Ownership History
Date
Name
Owned For
Owner Type
Purchase Details
Closed on
Sep 9, 2011
Sold by
Brongel Magdalen E and Baker Charmaine M
Bought by
Jeppson Robert and Jeppson Leasa
Current Estimated Value
Purchase Details
Closed on
Aug 1, 2008
Sold by
Brongel Magdalen E
Bought by
Brongel Magdalen E and Baker Charmaine M
Purchase Details
Closed on
Sep 23, 2005
Sold by
Brongel Magdalen E and Brongel Thomas G
Bought by
Brongel Magdalen E
Create a Home Valuation Report for This Property
The Home Valuation Report is an in-depth analysis detailing your home's value as well as a comparison with similar homes in the area
Home Values in the Area
Average Home Value in this Area
Purchase History
| Date | Buyer | Sale Price | Title Company |
|---|---|---|---|
| Jeppson Robert | $79,900 | First American Title Insuran | |
| Brongel Magdalen E | -- | None Available | |
| Brongel Magdalen E | -- | None Available |
Source: Public Records
Tax History
| Year | Tax Paid | Tax Assessment Tax Assessment Total Assessment is a certain percentage of the fair market value that is determined by local assessors to be the total taxable value of land and additions on the property. | Land | Improvement |
|---|---|---|---|---|
| 2024 | $1,369 | $35,870 | $5,220 | $30,650 |
| 2023 | $1,743 | $33,029 | $4,791 | $28,238 |
| 2022 | $1,398 | $30,699 | $4,453 | $26,246 |
| 2021 | $1,416 | $29,281 | $4,247 | $25,034 |
| 2020 | $1,404 | $28,562 | $4,143 | $24,419 |
| 2019 | $1,365 | $28,065 | $4,071 | $23,994 |
| 2018 | $1,306 | $27,325 | $3,964 | $23,361 |
| 2017 | $1,271 | $27,030 | $3,921 | $23,109 |
| 2016 | $1,208 | $26,139 | $3,792 | $22,347 |
| 2015 | $1,055 | $25,250 | $3,663 | $21,587 |
| 2012 | -- | $26,873 | $3,899 | $22,974 |
Source: Public Records
Map
Nearby Homes
Your Personal Tour Guide
Ask me questions while you tour the home.