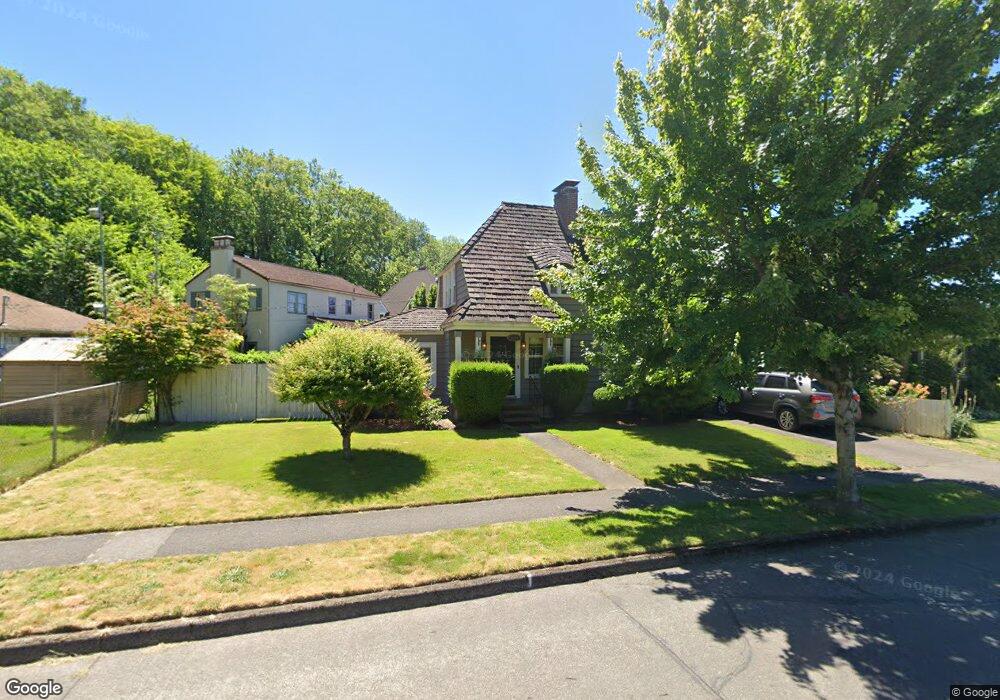
2619 Garfield St Longview, WA 98632
Olympic East NeighborhoodEstimated Value: $401,000 - $553,000
3
Beds
2
Baths
2,400
Sq Ft
$194/Sq Ft
Est. Value
About This Home
This home is located at 2619 Garfield St, Longview, WA 98632 and is currently estimated at $466,014, approximately $194 per square foot. 2619 Garfield St is a home located in Cowlitz County with nearby schools including Olympic Elementary School, Monticello Middle School, and R.A. Long High School.
Ownership History
Date
Name
Owned For
Owner Type
Purchase Details
Closed on
Apr 28, 2009
Sold by
Kerker Scott R and Kerker Rachel A
Bought by
Sells William L and Sells Penelope P
Current Estimated Value
Home Financials for this Owner
Home Financials are based on the most recent Mortgage that was taken out on this home.
Original Mortgage
$215,000
Outstanding Balance
$136,863
Interest Rate
4.99%
Mortgage Type
Purchase Money Mortgage
Estimated Equity
$329,151
Create a Home Valuation Report for This Property
The Home Valuation Report is an in-depth analysis detailing your home's value as well as a comparison with similar homes in the area
Home Values in the Area
Average Home Value in this Area
Purchase History
| Date | Buyer | Sale Price | Title Company |
|---|---|---|---|
| Sells William L | $271,953 | Stewart Title |
Source: Public Records
Mortgage History
| Date | Status | Borrower | Loan Amount |
|---|---|---|---|
| Open | Sells William L | $215,000 |
Source: Public Records
Tax History
| Year | Tax Paid | Tax Assessment Tax Assessment Total Assessment is a certain percentage of the fair market value that is determined by local assessors to be the total taxable value of land and additions on the property. | Land | Improvement |
|---|---|---|---|---|
| 2024 | $3,446 | $397,820 | $45,310 | $352,510 |
| 2023 | $4,081 | $472,830 | $45,310 | $427,520 |
| 2022 | $756 | $460,380 | $45,310 | $415,070 |
| 2021 | $812 | $106,996 | $0 | $106,996 |
| 2020 | $820 | $339,170 | $43,160 | $296,010 |
| 2019 | $864 | $333,363 | $43,155 | $290,208 |
| 2018 | $904 | $293,340 | $43,160 | $250,180 |
| 2017 | $2,957 | $267,490 | $34,930 | $232,560 |
| 2016 | $2,426 | $229,430 | $33,270 | $196,160 |
| 2015 | $2,432 | $192,360 | $33,270 | $159,090 |
| 2013 | -- | $177,380 | $32,300 | $145,080 |
Source: Public Records
Map
Nearby Homes
- 2824 Garfield St
- 2829 Field St
- 2902 Garfield St
- 2902 Dover St
- 1202 21st Ave
- 3008 Garfield St
- 1215 30th Ave
- 2714 Louisiana St
- 2830 Colorado St
- 3025 Florida St
- 3052 Florida St
- 3102 Garfield St
- 3102 Hemlock St
- 571 26th Ave
- 2929 Louisiana St
- 1603 23rd Ave
- 835 20th Ave
- 646 23rd Ave
- 1408 20th Ave Unit B1
- 1308 19th Ave
Your Personal Tour Guide
Ask me questions while you tour the home.