Estimated Value: $775,000 - $882,000
4
Beds
3
Baths
2,596
Sq Ft
$315/Sq Ft
Est. Value
About This Home
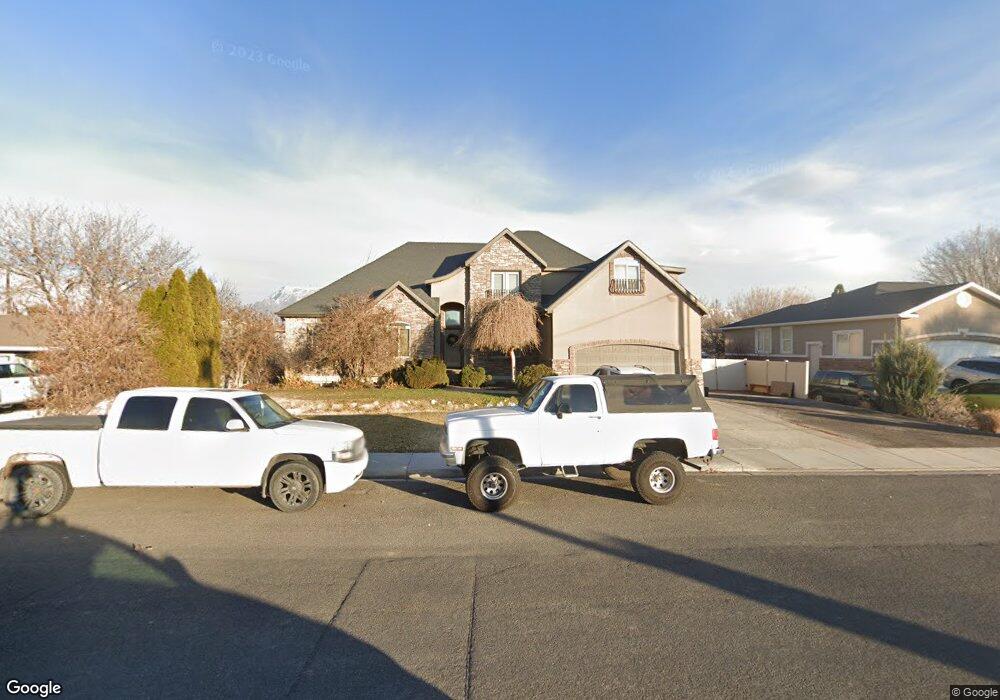
This home is located at 262 N 400 E, Lehi, UT 84043 and is currently estimated at $818,553, approximately $315 per square foot. 262 N 400 E is a home located in Utah County with nearby schools including Lehi Elementary School, Lehi Junior High School, and Lehi High School.
Ownership History
Date
Name
Owned For
Owner Type
Purchase Details
Closed on
Aug 26, 2024
Sold by
Jensen Dirk C and Jensen Amy P
Bought by
Dirk And Amy Jensen Living Trust and Jensen
Current Estimated Value
Purchase Details
Closed on
Aug 24, 2004
Sold by
Seager Donna and Cooper Vickie L
Bought by
Jensen Dirk C and Jensen Amy P
Home Financials for this Owner
Home Financials are based on the most recent Mortgage that was taken out on this home.
Original Mortgage
$33,805
Interest Rate
5.95%
Mortgage Type
Purchase Money Mortgage
Create a Home Valuation Report for This Property
The Home Valuation Report is an in-depth analysis detailing your home's value as well as a comparison with similar homes in the area
Home Values in the Area
Average Home Value in this Area
Purchase History
| Date | Buyer | Sale Price | Title Company |
|---|---|---|---|
| Dirk And Amy Jensen Living Trust | -- | None Listed On Document | |
| Jensen Dirk C | -- | Inwest Title Services Inc |
Source: Public Records
Mortgage History
| Date | Status | Borrower | Loan Amount |
|---|---|---|---|
| Previous Owner | Jensen Dirk C | $33,805 |
Source: Public Records
Tax History
| Year | Tax Paid | Tax Assessment Tax Assessment Total Assessment is a certain percentage of the fair market value that is determined by local assessors to be the total taxable value of land and additions on the property. | Land | Improvement |
|---|---|---|---|---|
| 2025 | $3,463 | $452,375 | -- | -- |
| 2024 | $3,463 | $405,295 | $0 | $0 |
| 2023 | $3,203 | $407,000 | $0 | $0 |
| 2022 | $3,366 | $414,645 | $0 | $0 |
| 2021 | $3,101 | $577,500 | $121,300 | $456,200 |
| 2020 | $2,926 | $538,700 | $112,300 | $426,400 |
| 2019 | $2,524 | $483,100 | $112,300 | $370,800 |
| 2018 | $2,478 | $448,300 | $102,700 | $345,600 |
| 2017 | $2,308 | $221,980 | $0 | $0 |
| 2016 | $2,271 | $202,620 | $0 | $0 |
| 2015 | $2,032 | $172,095 | $0 | $0 |
| 2014 | $2,036 | $171,435 | $0 | $0 |
Source: Public Records
Map
Nearby Homes
Your Personal Tour Guide
Ask me questions while you tour the home.