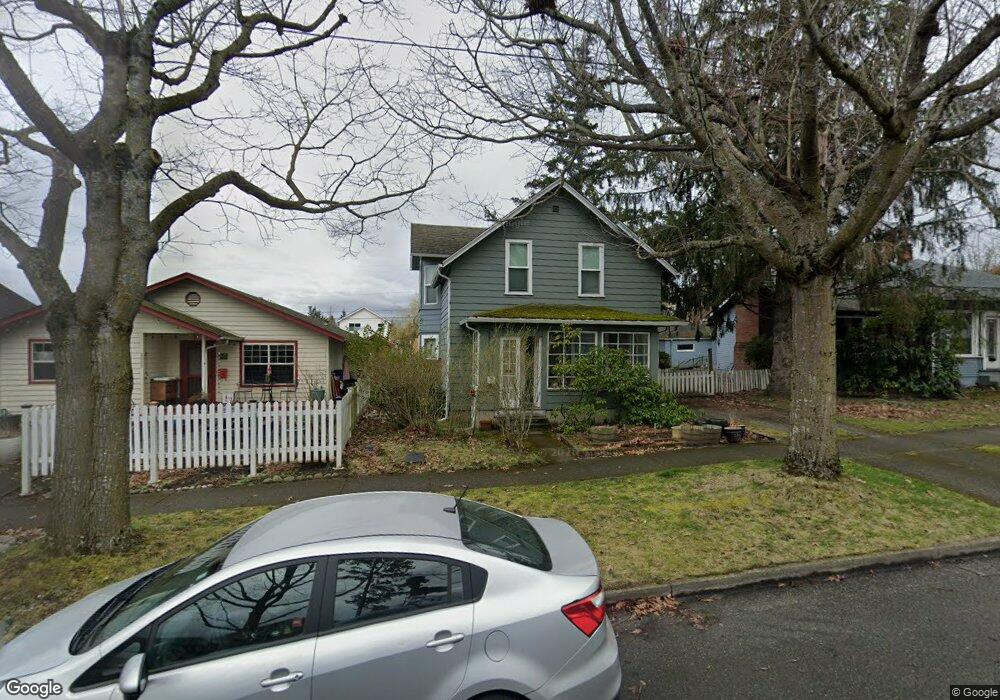
2627 James St Bellingham, WA 98225
Sunnyland NeighborhoodEstimated Value: $528,000 - $661,000
2
Beds
1
Bath
1,258
Sq Ft
$463/Sq Ft
Est. Value
About This Home
This home is located at 2627 James St, Bellingham, WA 98225 and is currently estimated at $582,174, approximately $462 per square foot. 2627 James St is a home located in Whatcom County with nearby schools including Sunnyland Elementary School, Whatcom Middle School, and Bellingham High School.
Ownership History
Date
Name
Owned For
Owner Type
Purchase Details
Closed on
May 23, 2002
Sold by
Caspe Detzer Martin and Caspe Detzer Ariel
Bought by
Stenhoff Eric D and Stenhoff Amy K
Current Estimated Value
Home Financials for this Owner
Home Financials are based on the most recent Mortgage that was taken out on this home.
Original Mortgage
$120,200
Outstanding Balance
$49,280
Interest Rate
6.94%
Estimated Equity
$532,894
Create a Home Valuation Report for This Property
The Home Valuation Report is an in-depth analysis detailing your home's value as well as a comparison with similar homes in the area
Home Values in the Area
Average Home Value in this Area
Purchase History
| Date | Buyer | Sale Price | Title Company |
|---|---|---|---|
| Stenhoff Eric D | $124,000 | First American Title Insuran |
Source: Public Records
Mortgage History
| Date | Status | Borrower | Loan Amount |
|---|---|---|---|
| Open | Stenhoff Eric D | $120,200 |
Source: Public Records
Tax History
| Year | Tax Paid | Tax Assessment Tax Assessment Total Assessment is a certain percentage of the fair market value that is determined by local assessors to be the total taxable value of land and additions on the property. | Land | Improvement |
|---|---|---|---|---|
| 2025 | $4,061 | $510,871 | $237,840 | $273,031 |
| 2024 | $3,959 | $495,985 | $230,910 | $265,075 |
| 2023 | $3,959 | $508,583 | $236,775 | $271,808 |
| 2022 | $3,232 | $438,442 | $204,120 | $234,322 |
| 2021 | $3,171 | $347,970 | $162,000 | $185,970 |
| 2020 | $2,969 | $322,194 | $150,000 | $172,194 |
| 2019 | $2,658 | $291,551 | $124,778 | $166,773 |
| 2018 | $2,676 | $261,711 | $112,028 | $149,683 |
| 2017 | $2,308 | $225,324 | $96,450 | $128,874 |
| 2016 | $2,020 | $203,060 | $86,550 | $116,510 |
| 2015 | $1,980 | $185,004 | $79,050 | $105,954 |
| 2014 | -- | $175,526 | $75,000 | $100,526 |
| 2013 | -- | $177,691 | $75,600 | $102,091 |
Source: Public Records
Map
Nearby Homes
- 2612 James St
- 605 Alabama St
- 403 Alabama St
- 1100 E Illinois St
- 3005 King St
- 530 E Sunset Dr Unit 10
- 530 E Sunset Dr Unit 14
- 530 E Sunset Dr Unit 12
- 2313 Moore St
- 2617 Pacific St
- 2424 Orleans St
- 2500 Cornwall Ave
- 1408 E Maryland St
- 2312 Orleans St
- 2119 Humboldt St
- 409 Kentucky St
- 2950 Plymouth Dr
- 3004 Barkley Meadows Cir
- 2739 Sunset Dr
- 2911 St Paul St
Your Personal Tour Guide
Ask me questions while you tour the home.