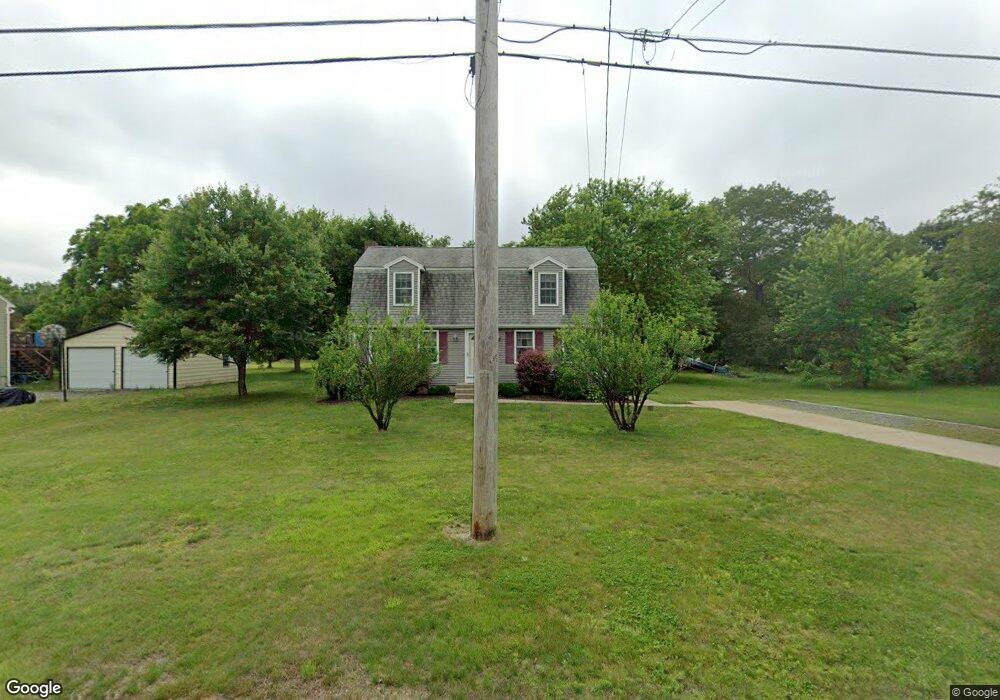
263 Elm Terrace Mansfield, MA 02048
Estimated Value: $565,000 - $703,000
3
Beds
2
Baths
1,532
Sq Ft
$416/Sq Ft
Est. Value
About This Home
This home is located at 263 Elm Terrace, Mansfield, MA 02048 and is currently estimated at $637,628, approximately $416 per square foot. 263 Elm Terrace is a home located in Bristol County with nearby schools including Everett W. Robinson Elementary School, Jordan/Jackson Elementary School, and Harold L. Qualters Middle School.
Ownership History
Date
Name
Owned For
Owner Type
Purchase Details
Closed on
Sep 5, 1986
Bought by
Brown Michael F and Brown Tamrah B
Current Estimated Value
Create a Home Valuation Report for This Property
The Home Valuation Report is an in-depth analysis detailing your home's value as well as a comparison with similar homes in the area
Home Values in the Area
Average Home Value in this Area
Purchase History
We collect this data history from publicly available records. To have your information removed, we recommend requesting removal directly through your county’s website.
| Date | Buyer | Sale Price | Title Company |
|---|---|---|---|
| Brown Michael F | -- | -- |
Source: Public Records
Mortgage History
We collect this data history from publicly available records. To have your information removed, we recommend requesting removal directly through your county’s website.
| Date | Status | Borrower | Loan Amount |
|---|---|---|---|
| Open | Brown Michael F | $152,750 | |
| Closed | Brown Michael F | $38,800 | |
| Closed | Brown Michael F | $115,000 |
Source: Public Records
Tax History
| Year | Tax Paid | Tax Assessment Tax Assessment Total Assessment is a certain percentage of the fair market value that is determined by local assessors to be the total taxable value of land and additions on the property. | Land | Improvement |
|---|---|---|---|---|
| 2025 | $6,939 | $526,900 | $246,600 | $280,300 |
| 2024 | $6,637 | $491,600 | $235,400 | $256,200 |
| 2023 | $6,469 | $459,100 | $235,400 | $223,700 |
| 2022 | $6,235 | $411,000 | $218,000 | $193,000 |
| 2021 | $6,413 | $417,500 | $207,600 | $209,900 |
| 2020 | $5,927 | $385,900 | $181,600 | $204,300 |
| 2019 | $5,770 | $379,100 | $172,900 | $206,200 |
| 2018 | $5,469 | $367,500 | $165,000 | $202,500 |
| 2017 | $4,090 | $357,100 | $160,300 | $196,800 |
| 2016 | $5,153 | $334,400 | $152,500 | $181,900 |
| 2015 | $5,038 | $325,000 | $152,500 | $172,500 |
Source: Public Records
Map
Nearby Homes
- 14 Claire Ave
- 1125 School St
- 174 Gilbert St
- 85 Jewell St
- 14 Lancelot Ln
- 238 N Worcester St
- 49 Pheasant Hill Rd
- 343 Godfrey Dr
- 26 Pinto Way
- 42 Colts Way
- 162 Godfrey Dr Unit 162
- 179 Dean St
- 5 Juniper Dr
- 139 Grove St
- 3 Morse Ct
- 361 Richardson Ave
- 75 Fowler St
- 19 Barberry Rd
- 26 Donald Tennant Cir
- 10 Anna Way
Your Personal Tour Guide
Ask me questions while you tour the home.