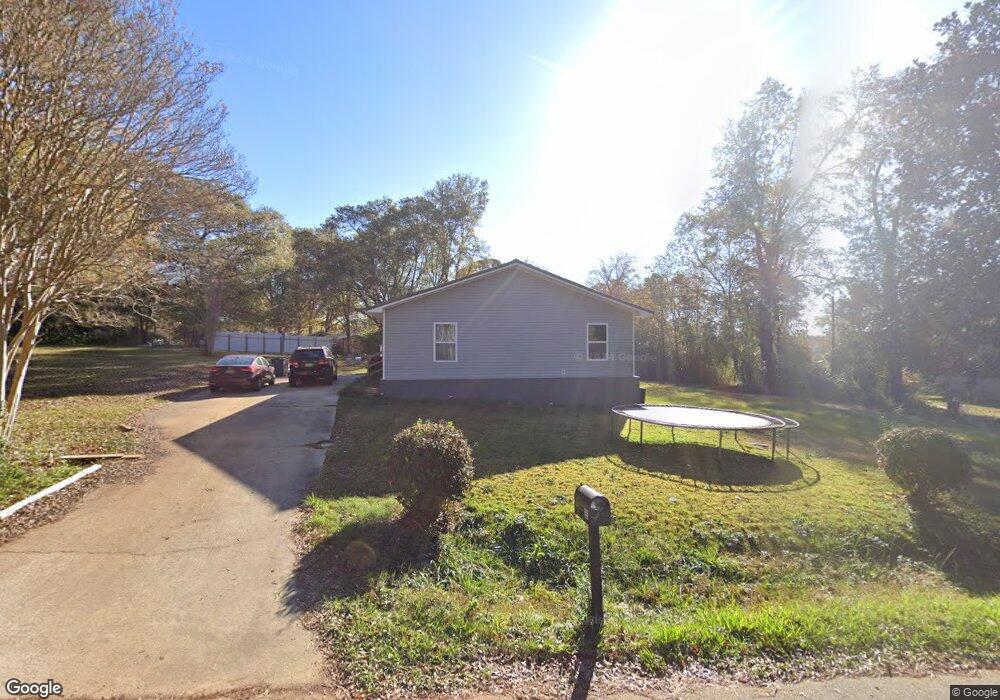
263 Givens Cir West Point, GA 31833
Estimated Value: $62,000 - $238,112
2
Beds
2
Baths
1,754
Sq Ft
$106/Sq Ft
Est. Value
About This Home
This home is located at 263 Givens Cir, West Point, GA 31833 and is currently estimated at $186,278, approximately $106 per square foot. 263 Givens Cir is a home located in Troup County with nearby schools including West Point Elementary School, Long Cane Elementary School, and Berta Weathersbee Elementary School.
Ownership History
Date
Name
Owned For
Owner Type
Purchase Details
Closed on
Aug 22, 2022
Sold by
Stone Christiopher
Bought by
Schwalm Julia C and Schwalm Christian D
Current Estimated Value
Home Financials for this Owner
Home Financials are based on the most recent Mortgage that was taken out on this home.
Original Mortgage
$202,024
Outstanding Balance
$191,693
Interest Rate
5.12%
Mortgage Type
FHA
Estimated Equity
-$5,415
Purchase Details
Closed on
Jun 21, 2021
Sold by
Walker Bradley
Bought by
Stone Christiopher
Purchase Details
Closed on
Sep 9, 2016
Bought by
Lawhorn Richard and Lawhorn Reba
Purchase Details
Closed on
Jan 20, 2015
Sold by
The Sec Of Housing A
Bought by
Bank Of America
Purchase Details
Closed on
Jul 1, 2014
Sold by
Bank Of America
Bought by
Sec Of Housing & Urban
Purchase Details
Closed on
Oct 4, 2001
Sold by
Jones Frank and Jones June M
Bought by
Walker Bradley D
Purchase Details
Closed on
Jan 12, 1965
Sold by
Brumbeloe Luther B
Bought by
Jones Frank and Jones June M
Create a Home Valuation Report for This Property
The Home Valuation Report is an in-depth analysis detailing your home's value as well as a comparison with similar homes in the area
Home Values in the Area
Average Home Value in this Area
Purchase History
| Date | Buyer | Sale Price | Title Company |
|---|---|---|---|
| Schwalm Julia C | $209,000 | -- | |
| Stone Christiopher | $60,000 | -- | |
| Lawhorn Richard | $32,000 | -- | |
| Bank Of America | -- | -- | |
| Sec Of Housing & Urban | -- | -- | |
| Bank Of America | -- | -- | |
| Walker Bradley D | $51,000 | -- | |
| Jones Frank | -- | -- |
Source: Public Records
Mortgage History
| Date | Status | Borrower | Loan Amount |
|---|---|---|---|
| Open | Schwalm Julia C | $202,024 |
Source: Public Records
Tax History
| Year | Tax Paid | Tax Assessment Tax Assessment Total Assessment is a certain percentage of the fair market value that is determined by local assessors to be the total taxable value of land and additions on the property. | Land | Improvement |
|---|---|---|---|---|
| 2025 | $2,327 | $90,520 | $4,520 | $86,000 |
| 2024 | $2,223 | $81,520 | $4,520 | $77,000 |
| 2023 | $2,280 | $85,920 | $4,520 | $81,400 |
| 2022 | $670 | $27,120 | $4,520 | $22,600 |
| 2021 | $642 | $21,280 | $3,760 | $17,520 |
| 2020 | $642 | $21,280 | $3,760 | $17,520 |
| 2019 | $597 | $19,800 | $3,760 | $16,040 |
| 2018 | $565 | $18,720 | $3,920 | $14,800 |
| 2017 | $385 | $18,720 | $3,920 | $14,800 |
| 2016 | $880 | $29,178 | $2,180 | $26,998 |
| 2015 | $881 | $29,178 | $2,180 | $26,998 |
| 2014 | $840 | $27,757 | $2,180 | $25,577 |
| 2013 | -- | $28,580 | $2,180 | $26,400 |
Source: Public Records
Map
Nearby Homes
- 0 Samples Rd Unit 10705121
- 0 Ga Highway 0116 Unit 10619139
- 1903 Ridgewood Dr
- 508 Pine St
- 1800 Malco Dr
- 0 Sunset Dr Unit 10451831
- 1111 County Road 212
- 1418 E 10th St
- 4517 Georgia 18
- 4509 Georgia 18
- 4523 Georgia 18
- 4527 Georgia 18
- 1202 E 9th St
- 900 E 9th St
- 1007 4th Ave
- 0 Arrowhead Dr Unit 10451860
- 1114 Clara Dr E
- 1111 Clara Dr E
- 1104 E 8th St
- 707 E 7th St
- 263 Givens Cir Unit Lots 41 & 42
- 111 Givens Cir
- 291 Givens Cir
- 123 Givens Cir
- 95 Givens Cir
- 85 Givens Cir
- 47 North Rd
- 104 Givens Cir
- 254 Givens Cir
- 225 Givens Cir
- 294 Givens Cir
- 303 Givens Cir
- 132 Givens Cir
- 80 Givens Cir
- 306 Givens Cir
- 72 Givens Cir
- 142 Givens Cir
- 214 Givens Cir
- 311 Givens Cir
- 270 Givens Cir
Your Personal Tour Guide
Ask me questions while you tour the home.