263 Norfolk St Springfield, MA 01109
Upper Hill NeighborhoodEstimated Value: $266,559
About This Home
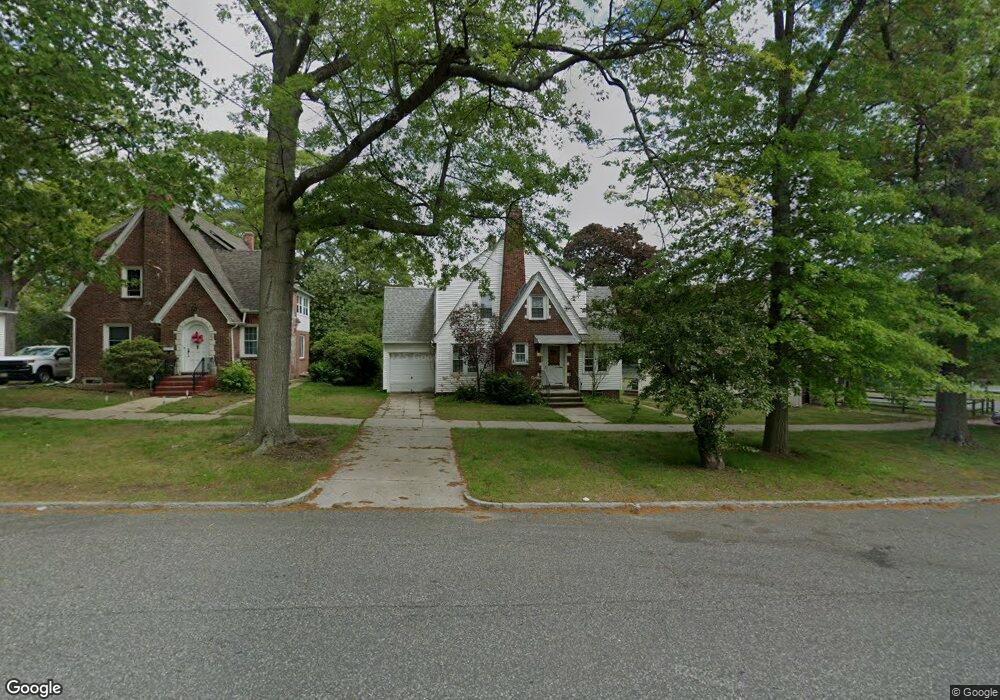
This home is located at 263 Norfolk St, Springfield, MA 01109 and is currently estimated at $266,559, approximately $155 per square foot. 263 Norfolk St is a home located in Hampden County with nearby schools including Daniel B Brunton, John J Duggan Middle, and Springfield High School of Science and Technology.
Ownership History
We collect this data history from publicly available records. To have your information removed, we recommend requesting removal directly through your county’s website.
Purchase Details
Purchase Details
Home Financials for this Owner
Home Financials are based on the most recent Mortgage that was taken out on this home.Home Values in the Area
Average Home Value in this Area
Purchase History
We collect this data history from publicly available records. To have your information removed, we recommend requesting removal directly through your county’s website.
| Date | Buyer | Sale Price | Title Company |
|---|---|---|---|
| $130,000 | -- | ||
| $67,500 | -- |
Mortgage History
We collect this data history from publicly available records. To have your information removed, we recommend requesting removal directly through your county’s website.
| Date | Status | Borrower | Loan Amount |
|---|---|---|---|
| Previous Owner | $54,000 |
Tax History
We collect this data history from publicly available records. To have your information removed, we recommend requesting removal directly through your county’s website.
| Year | Tax Paid | Tax Assessment Tax Assessment Total Assessment is a certain percentage of the fair market value that is determined by local assessors to be the total taxable value of land and additions on the property. | Land | Improvement |
|---|---|---|---|---|
| 2025 | -- | $307,600 | $38,600 | $269,000 |
| 2024 | -- | $270,400 | $32,100 | $238,300 |
| 2023 | $0 | $235,400 | $29,200 | $206,200 |
| 2022 | $0 | $198,400 | $27,300 | $171,100 |
| 2021 | $0 | $124,900 | $24,800 | $100,100 |
| 2020 | $0 | $124,900 | $24,800 | $100,100 |
| 2019 | $0 | $124,900 | $24,800 | $100,100 |
| 2018 | $0 | $124,900 | $24,800 | $100,100 |
| 2017 | $0 | $124,900 | $23,000 | $101,900 |
| 2016 | -- | $124,900 | $23,000 | $101,900 |
| 2015 | -- | $124,900 | $14,400 | $110,500 |
Map
- 881 Roosevelt Ave
- 119-121 Middlesex St
- 106 Suffolk St
- 59-61 Carlisle St
- 746-748 Alden St
- 21 Westford Cir
- 26 Byron St
- 105 Overlook Dr
- 620 Roosevelt Ave
- 115-117 Northampton Ave
- 545-547 Wilbraham Rd
- 29 Rosella St
- 36-38 Chapel St
- 43 Agnes St
- 199 Eastern Ave
- 378 Roosevelt Ave
- 20 Conklin St
- 157 Lebanon St
- 69 Manhattan St
- 49 Andrew St
- 241 Norfolk St
- 245 Norfolk St
- 235 Norfolk St
- 251 Norfolk St
- 229 Norfolk St
- 255 Norfolk St
- 225 Norfolk St
- 221 Norfolk St
- 226 Norfolk St
- 215 Norfolk St
- 229 Bristol St
- 220 Norfolk St Unit 222
- 225 Bristol St
- 221 Bristol St
- 209 Norfolk St
- 216 Norfolk St
- 215 Bristol St
- 16 Northumberland St
- 205 Norfolk St
- 209 Bristol St
Ask me questions while you tour the home.