264 Castle Rocks Rd Warwick, RI 02886
Cowesett NeighborhoodEstimated Value: $806,279 - $886,000
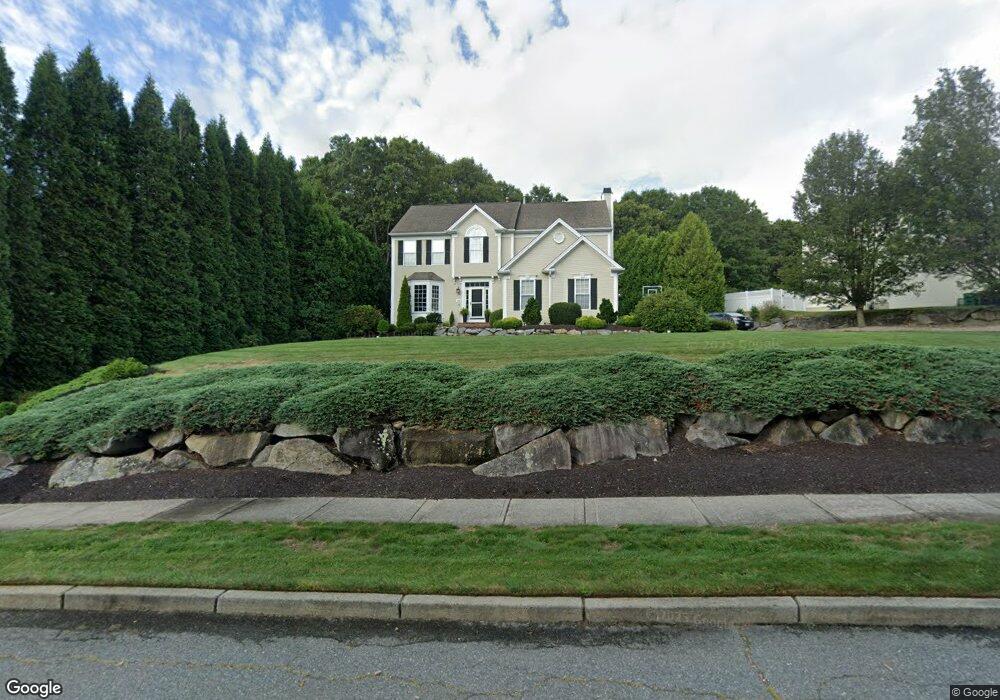
About This Home
This home is located at 264 Castle Rocks Rd, Warwick, RI 02886 and is currently estimated at $848,820, approximately $337 per square foot. 264 Castle Rocks Rd is a home located in Kent County with nearby schools including Our Lady of Mercy School.
Ownership History
We collect this data history from publicly available records. To have your information removed, we recommend requesting removal directly through your county’s website.
Purchase Details
Home Financials for this Owner
Home Financials are based on the most recent Mortgage that was taken out on this home.Home Values in the Area
Average Home Value in this Area
Purchase History
We collect this data history from publicly available records. To have your information removed, we recommend requesting removal directly through your county’s website.
| Date | Buyer | Sale Price | Title Company |
|---|---|---|---|
| $404,000 | -- |
Mortgage History
We collect this data history from publicly available records. To have your information removed, we recommend requesting removal directly through your county’s website.
| Date | Status | Borrower | Loan Amount |
|---|---|---|---|
| Open | $311,000 | ||
| Closed | $116,000 | ||
| Closed | $320,000 | ||
| Previous Owner | $193,000 |
Tax History
We collect this data history from publicly available records. To have your information removed, we recommend requesting removal directly through your county’s website.
| Year | Tax Paid | Tax Assessment Tax Assessment Total Assessment is a certain percentage of the fair market value that is determined by local assessors to be the total taxable value of land and additions on the property. | Land | Improvement |
|---|---|---|---|---|
| 2025 | $7,659 | $603,100 | $156,600 | $446,500 |
| 2024 | $8,385 | $579,500 | $136,100 | $443,400 |
| 2023 | $8,223 | $579,500 | $136,100 | $443,400 |
| 2022 | $8,297 | $443,000 | $100,500 | $342,500 |
| 2021 | $8,297 | $443,000 | $100,500 | $342,500 |
| 2020 | $8,297 | $443,000 | $100,500 | $342,500 |
| 2019 | $8,297 | $443,000 | $100,500 | $342,500 |
| 2018 | $8,135 | $391,100 | $100,500 | $290,600 |
| 2017 | $7,916 | $391,100 | $100,500 | $290,600 |
| 2016 | $7,916 | $391,100 | $100,500 | $290,600 |
| 2015 | $7,694 | $370,800 | $102,600 | $268,200 |
| 2014 | $7,438 | $370,800 | $102,600 | $268,200 |
| 2013 | $7,338 | $370,800 | $102,600 | $268,200 |
Map
- 283 Castle Rocks Rd
- 115 Castle Rocks Rd
- 322 Sleepy Hollow Farm Rd
- 0 Joseph Ct
- 100 Joseph Ct
- 486 Greenbush Rd
- 193 Sleepy Hollow Farm Rd
- 510 Greenbush Rd
- 520 Greenbush Rd
- 30 Abigail St
- 3 Cedar Rock Meadows
- 34 Eagle Run Unit C
- 396 Love Ln
- 187 Love Ln
- 36 Edmond Dr
- 135 Howland Rd
- 122 Sylvan Dr
- 2 Eagle Run Unit A
- 41 Bruce Ln
- 7 Eagle Run Unit B
- 282 Castle Rocks Rd
- 250 Castle Rocks Rd
- 294 Castle Rocks Rd
- 236 Castle Rocks Rd
- 269 Castle Rocks Rd
- 275 Castle Rocks Rd
- 255 Castle Rocks Rd
- 308 Castle Rocks Rd
- 247 Castle Rocks Rd
- 224 Castle Rocks Rd
- 237 Castle Rocks Rd
- 293 Castle Rocks Rd
- 44 Castle Rocks Rd
- 305 Castle Rocks Rd
- 24 Castle Rocks Rd
- 22 Castle Rocks Rd
- 14 Castle Rocks Rd
- 229 Castle Rocks Rd
- 56 Castle Rocks Rd
- 208 Castle Rocks Rd
Ask me questions while you tour the home.