265 Jackson St Buford, GA 30518
Estimated Value: $494,488 - $541,000
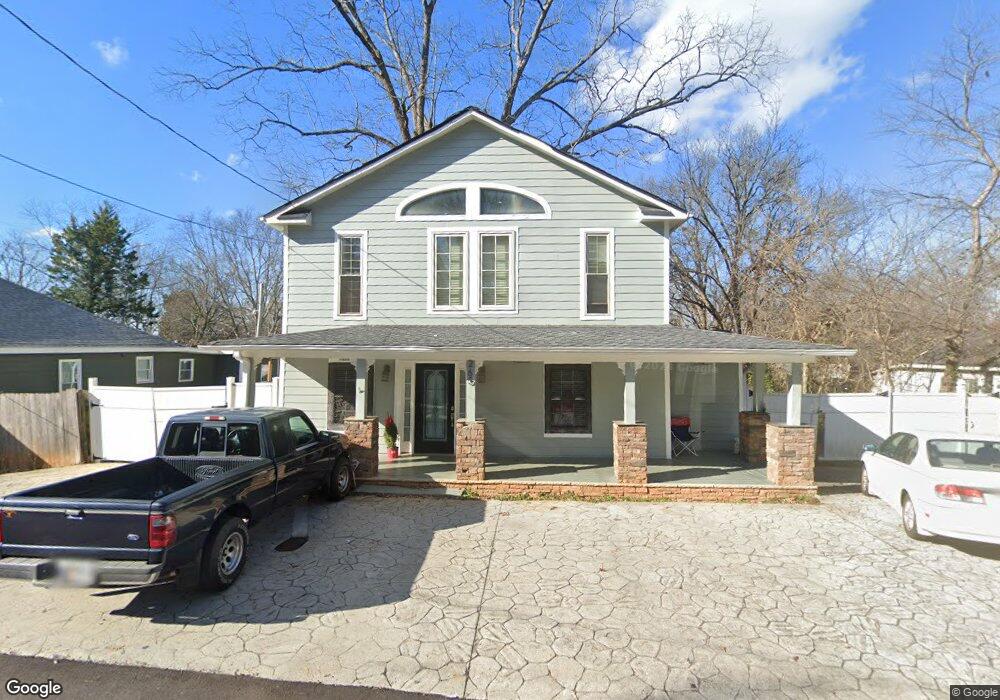
About This Home
This home is located at 265 Jackson St, Buford, GA 30518 and is currently estimated at $522,372, approximately $232 per square foot. 265 Jackson St is a home located in Gwinnett County with nearby schools including Buford Elementary School, Buford Senior Academy, and Buford Academy.
Ownership History
We collect this data history from publicly available records. To have your information removed, we recommend requesting removal directly through your county’s website.
Purchase Details
Purchase Details
Purchase Details
Home Financials for this Owner
Home Financials are based on the most recent Mortgage that was taken out on this home.Home Values in the Area
Average Home Value in this Area
Purchase History
We collect this data history from publicly available records. To have your information removed, we recommend requesting removal directly through your county’s website.
| Date | Buyer | Sale Price | Title Company |
|---|---|---|---|
| $8,600 | -- | ||
| -- | -- | ||
| $94,540 | -- | ||
| $48,000 | -- |
Mortgage History
We collect this data history from publicly available records. To have your information removed, we recommend requesting removal directly through your county’s website.
| Date | Status | Borrower | Loan Amount |
|---|---|---|---|
| Previous Owner | $75,000 |
Tax History
We collect this data history from publicly available records. To have your information removed, we recommend requesting removal directly through your county’s website.
| Year | Tax Paid | Tax Assessment Tax Assessment Total Assessment is a certain percentage of the fair market value that is determined by local assessors to be the total taxable value of land and additions on the property. | Land | Improvement |
|---|---|---|---|---|
| 2025 | $2,848 | $198,440 | $40,000 | $158,440 |
| 2024 | -- | $197,080 | $33,600 | $163,480 |
| 2023 | $602 | $142,360 | $26,000 | $116,360 |
| 2022 | $745 | $142,360 | $26,000 | $116,360 |
| 2021 | $745 | $103,480 | $16,800 | $86,680 |
| 2020 | $745 | $103,480 | $16,800 | $86,680 |
| 2019 | $673 | $98,080 | $16,800 | $81,280 |
| 2018 | $673 | $61,720 | $5,600 | $56,120 |
| 2016 | $668 | $61,720 | $5,600 | $56,120 |
| 2015 | $488 | $36,760 | $5,600 | $31,160 |
| 2014 | -- | $34,400 | $5,600 | $28,800 |
Map
- 210 N Church St
- 116 W Main St
- 490 Jackson St
- 59 Spring St
- 1769 Rowland Pass
- 169 W Park St
- 240 Wilbanks St
- 250 Wilbanks St
- 172 E Shadburn Ave
- 120 N Gwinnett St
- 95 N Gwinnett St
- 29 E Park St
- 39 E Park St
- 243 N Gwinnett St
- 669 Jackson St
- 120 Poplar St
- 425 Church St
- 40 Montgomery Ln
- 110 Poplar St
- 168 Poplar St
- 275 Jackson St
- 255 Jackson St
- 125 Bell St
- 0 Bell St Unit 8972197
- 0 Bell St
- 254 Jackson St
- 301 Jackson St
- 294 Jackson St
- 130 N Alexander St
- 96 N Alexander St
- 3 Jackson St
- 125 N Church St
- 125 Church St
- 1 Jackson St
- 325 Jackson St
- 140 N Alexander St
- 75 Bell St
- N N Alexander St NE
- 135 Bell St
- 2 Jackson St
Ask me questions while you tour the home.