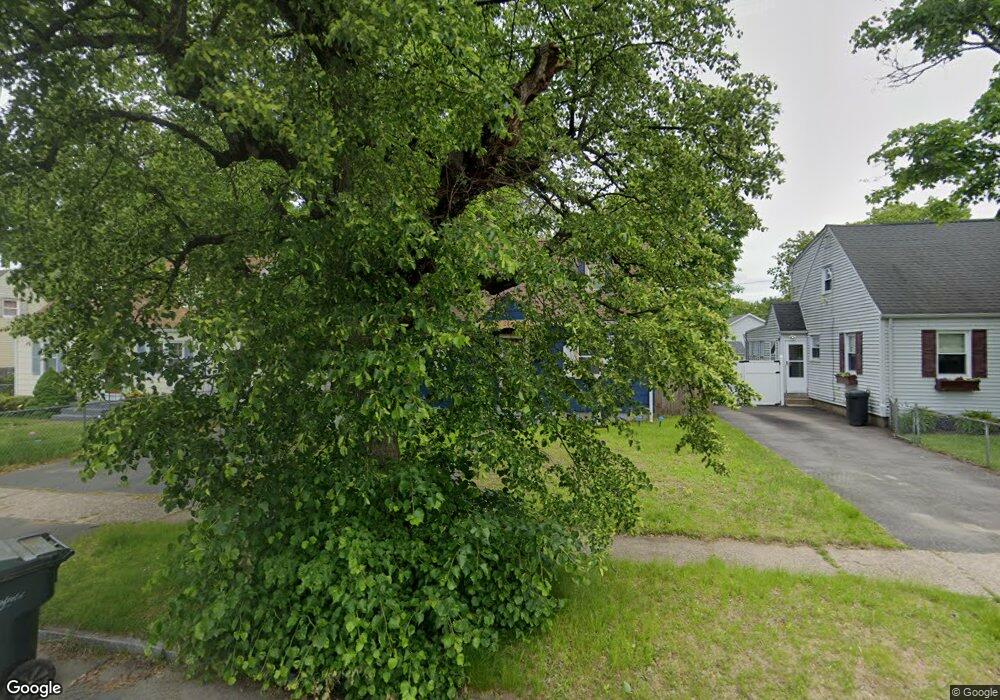
265 Rosewell St Springfield, MA 01109
Pine Point NeighborhoodEstimated Value: $248,324 - $308,000
3
Beds
1
Bath
1,008
Sq Ft
$276/Sq Ft
Est. Value
About This Home
This home is located at 265 Rosewell St, Springfield, MA 01109 and is currently estimated at $278,581, approximately $276 per square foot. 265 Rosewell St is a home located in Hampden County with nearby schools including Frank H. Freedman School, John J Duggan Middle, and Springfield Central High School.
Ownership History
Date
Name
Owned For
Owner Type
Purchase Details
Closed on
Sep 15, 1997
Sold by
R I Waterman Prop Inc
Bought by
White Rose L
Current Estimated Value
Home Financials for this Owner
Home Financials are based on the most recent Mortgage that was taken out on this home.
Original Mortgage
$2,068
Outstanding Balance
$333
Interest Rate
7.47%
Estimated Equity
$278,248
Purchase Details
Closed on
Apr 30, 1997
Sold by
Mccracken W Jeane and Tryon Anna R
Bought by
Ri Waterman Prop Inc
Create a Home Valuation Report for This Property
The Home Valuation Report is an in-depth analysis detailing your home's value as well as a comparison with similar homes in the area
Home Values in the Area
Average Home Value in this Area
Purchase History
| Date | Buyer | Sale Price | Title Company |
|---|---|---|---|
| White Rose L | $53,400 | -- | |
| Ri Waterman Prop Inc | $45,000 | -- |
Source: Public Records
Mortgage History
| Date | Status | Borrower | Loan Amount |
|---|---|---|---|
| Open | Ri Waterman Prop Inc | $2,068 | |
| Open | Ri Waterman Prop Inc | $54,090 | |
| Previous Owner | Ri Waterman Prop Inc | $14,489 |
Source: Public Records
Tax History
| Year | Tax Paid | Tax Assessment Tax Assessment Total Assessment is a certain percentage of the fair market value that is determined by local assessors to be the total taxable value of land and additions on the property. | Land | Improvement |
|---|---|---|---|---|
| 2025 | $3,377 | $215,400 | $39,500 | $175,900 |
| 2024 | $3,164 | $197,000 | $32,900 | $164,100 |
| 2023 | $2,982 | $174,900 | $29,900 | $145,000 |
| 2022 | $3,162 | $168,000 | $28,000 | $140,000 |
| 2021 | $2,640 | $139,700 | $25,400 | $114,300 |
| 2020 | $2,449 | $125,400 | $25,400 | $100,000 |
| 2019 | $2,218 | $112,700 | $25,400 | $87,300 |
| 2018 | $2,149 | $109,200 | $25,400 | $83,800 |
| 2017 | $2,104 | $107,000 | $23,500 | $83,500 |
| 2016 | $1,933 | $98,300 | $23,500 | $74,800 |
| 2015 | $1,890 | $96,100 | $23,500 | $72,600 |
Source: Public Records
Map
Nearby Homes
Your Personal Tour Guide
Ask me questions while you tour the home.