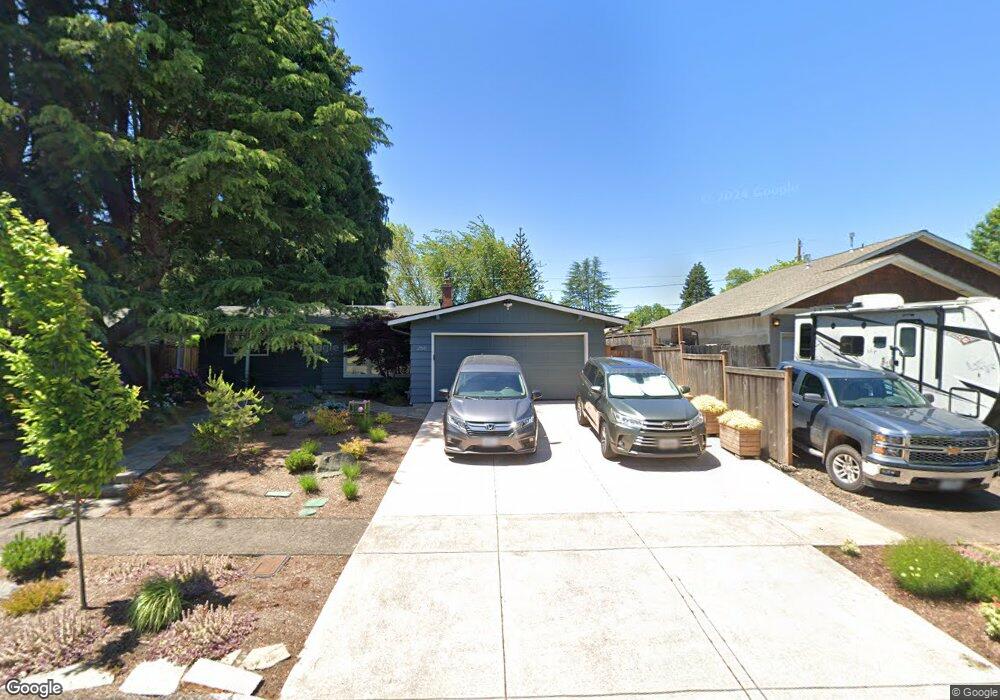
266 Roan Dr Eugene, OR 97401
Harlow NeighborhoodEstimated Value: $504,000 - $715,000
3
Beds
2
Baths
1,195
Sq Ft
$489/Sq Ft
Est. Value
About This Home
This home is located at 266 Roan Dr, Eugene, OR 97401 and is currently estimated at $584,895, approximately $489 per square foot. 266 Roan Dr is a home located in Lane County with nearby schools including Holt Elementary School, Monroe Middle School, and Sheldon High School.
Ownership History
Date
Name
Owned For
Owner Type
Purchase Details
Closed on
May 11, 2012
Sold by
Morrison Lesli A
Bought by
Morrison Lesli A and Miller Timothy J
Current Estimated Value
Home Financials for this Owner
Home Financials are based on the most recent Mortgage that was taken out on this home.
Original Mortgage
$160,000
Outstanding Balance
$110,484
Interest Rate
3.98%
Mortgage Type
New Conventional
Estimated Equity
$474,411
Purchase Details
Closed on
Sep 11, 2003
Sold by
Lam Lanny D and Lam Mickie M
Bought by
Morrison Lesli A
Home Financials for this Owner
Home Financials are based on the most recent Mortgage that was taken out on this home.
Original Mortgage
$117,800
Interest Rate
5.75%
Mortgage Type
Purchase Money Mortgage
Purchase Details
Closed on
Feb 17, 2003
Sold by
Vogt James E and Gregor John
Bought by
Lam Lanny D and Lam Mickie M
Home Financials for this Owner
Home Financials are based on the most recent Mortgage that was taken out on this home.
Original Mortgage
$100,000
Interest Rate
5.89%
Create a Home Valuation Report for This Property
The Home Valuation Report is an in-depth analysis detailing your home's value as well as a comparison with similar homes in the area
Home Values in the Area
Average Home Value in this Area
Purchase History
| Date | Buyer | Sale Price | Title Company |
|---|---|---|---|
| Morrison Lesli A | -- | Fidelity National Title Insu | |
| Morrison Lesli A | $158,000 | Cascade Title Co | |
| Lam Lanny D | $125,000 | Fidelity Natl Title Co Of Or |
Source: Public Records
Mortgage History
| Date | Status | Borrower | Loan Amount |
|---|---|---|---|
| Open | Morrison Lesli A | $160,000 | |
| Closed | Morrison Lesli A | $117,800 | |
| Previous Owner | Lam Lanny D | $100,000 |
Source: Public Records
Tax History
| Year | Tax Paid | Tax Assessment Tax Assessment Total Assessment is a certain percentage of the fair market value that is determined by local assessors to be the total taxable value of land and additions on the property. | Land | Improvement |
|---|---|---|---|---|
| 2025 | $5,208 | $267,295 | -- | -- |
| 2024 | $5,143 | $259,510 | -- | -- |
| 2023 | $5,143 | $251,952 | $0 | $0 |
| 2022 | $4,818 | $244,614 | $0 | $0 |
| 2021 | $4,526 | $237,490 | $0 | $0 |
| 2020 | $3,607 | $183,142 | $0 | $0 |
| 2019 | $3,484 | $177,808 | $0 | $0 |
| 2018 | $3,279 | $167,602 | $0 | $0 |
| 2017 | $3,133 | $167,602 | $0 | $0 |
| 2016 | $3,055 | $162,720 | $0 | $0 |
| 2015 | $2,967 | $157,981 | $0 | $0 |
| 2014 | $2,907 | $153,380 | $0 | $0 |
Source: Public Records
Map
Nearby Homes
- 280 Roan Dr
- 2994 Dapple Way
- 280 Regal Ct
- 349 van Duyn St
- 2746 Norbert Ln
- 2746 Harlow Rd
- 394 Cherry Dr
- 2872 Suffolk Ct
- 327 Rustic Place Unit 35
- 600 Cherry Dr Unit 8
- 600 Cherry Dr Unit 3
- 367 Rustic Place
- 347 Rustic Place Unit 14
- 825 Waverly St
- 2345 Pioneer Pike
- 950 Coburg Rd
- 1090 Corydon St
- 820 Lariat Dr
- 2250 Turnberry Ct
- 3700 Babcock Ln Unit 106
- 278 Roan Dr
- 250 Roan Dr
- 275 Hambletonian Dr
- 293 Hambletonian Dr
- 255 Hambletonian Dr
- 242 Roan Dr
- 279 Roan Dr
- 267 Roan Dr
- 333 Hambletonian Dr
- 283 Roan Dr
- 230 Fell Place
- 237 Hambletonian Dr
- 3180 Dapple Way
- 255 Roan Dr
- 233 Hambletonian Dr
- 3110 Dapple Way
- 245 Exmoor Place
- 298 Hambletonian Dr
- 258 Hambletonian Dr
- 206 Fell Place
Your Personal Tour Guide
Ask me questions while you tour the home.