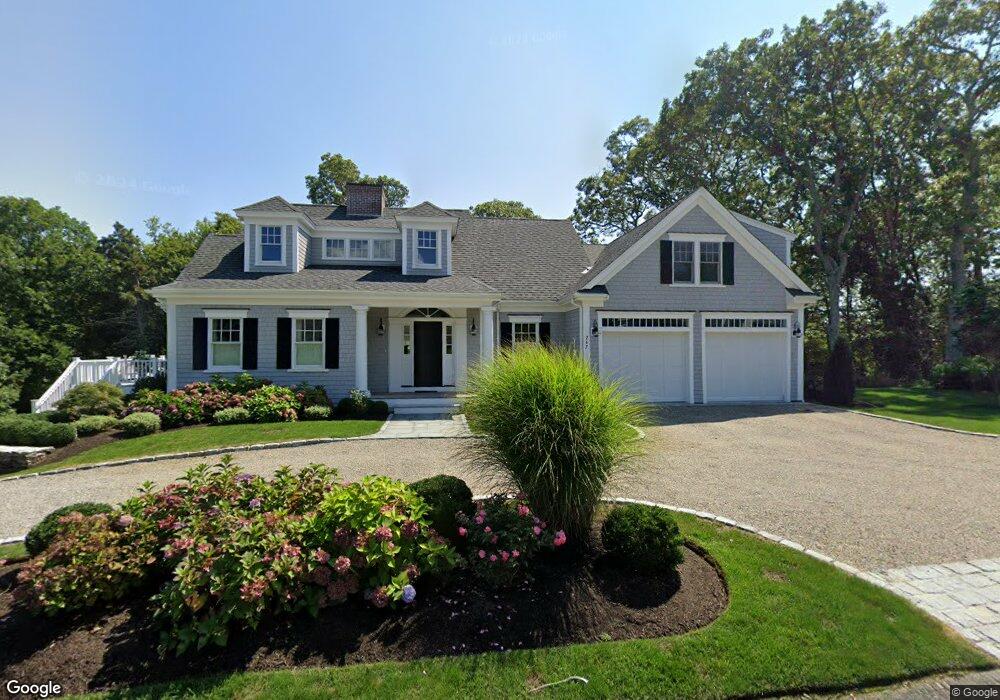
267 Cedar St Chatham, MA 02633
Chatham Village NeighborhoodEstimated Value: $3,071,000 - $3,529,000
4
Beds
5
Baths
3,430
Sq Ft
$966/Sq Ft
Est. Value
About This Home
This home is located at 267 Cedar St, Chatham, MA 02633 and is currently estimated at $3,313,379, approximately $965 per square foot. 267 Cedar St is a home located in Barnstable County with nearby schools including Chatham Elementary School, Harwich Elementary School, and Monomoy Regional Middle School.
Ownership History
Date
Name
Owned For
Owner Type
Purchase Details
Closed on
Aug 13, 2024
Sold by
Stephen J Carter Ret and Carter
Bought by
Elizabeth A Carter Ret and Carter
Current Estimated Value
Purchase Details
Closed on
Aug 10, 2006
Sold by
Carter Ft and Carter
Bought by
Stephen J Carter Ret and Carter
Create a Home Valuation Report for This Property
The Home Valuation Report is an in-depth analysis detailing your home's value as well as a comparison with similar homes in the area
Home Values in the Area
Average Home Value in this Area
Purchase History
| Date | Buyer | Sale Price | Title Company |
|---|---|---|---|
| Elizabeth A Carter Ret | -- | None Available | |
| Elizabeth A Carter Ret | -- | None Available | |
| Stephen J Carter Ret | $695,000 | -- | |
| Stephen J Carter Ret | $695,000 | -- |
Source: Public Records
Tax History
| Year | Tax Paid | Tax Assessment Tax Assessment Total Assessment is a certain percentage of the fair market value that is determined by local assessors to be the total taxable value of land and additions on the property. | Land | Improvement |
|---|---|---|---|---|
| 2025 | $9,210 | $2,654,100 | $926,200 | $1,727,900 |
| 2024 | $9,004 | $2,522,100 | $873,800 | $1,648,300 |
| 2023 | $8,449 | $2,177,600 | $661,900 | $1,515,700 |
| 2022 | $4,948 | $1,071,100 | $661,900 | $409,200 |
| 2021 | $4,315 | $866,400 | $662,100 | $204,300 |
| 2020 | $4,700 | $975,200 | $770,500 | $204,700 |
| 2019 | $4,486 | $924,900 | $720,200 | $204,700 |
| 2018 | $4,425 | $908,700 | $720,200 | $188,500 |
| 2017 | $4,438 | $882,300 | $699,200 | $183,100 |
| 2016 | $4,343 | $865,200 | $685,600 | $179,600 |
| 2015 | $4,206 | $842,900 | $666,100 | $176,800 |
| 2014 | $4,269 | $840,300 | $666,100 | $174,200 |
Source: Public Records
Map
Nearby Homes
- 287 Cedar St
- 15 Windy Hill Way
- 85 Cedar St
- 42 Champlain Rd
- 99 Uncle Alberts Drive Extension
- 157 Bridge St
- 55 Christopher Harding Ln
- 14 Pond View Ln
- 8 Kingsbury Way
- 92 Absegami Run
- 1239 Main St Unit 18
- 246 Stage Island Rd
- 346 Morris Island Rd
- 33 Crowell Rd
- 6 Munson Meeting Way Unit 894
- 6 Munson Meeting Way
- 912 Main St Unit 308
- 3 Oyster Dr
- 20 Jessies Landing
- 22 Starfish Ln Unit 22
- 274 Cedar St
- 284 Cedar St
- 303 Cedar St
- 296 Cedar St
- 16 Black Duck Landing
- 317 Cedar St
- 308 Cedar St
- 306 Cedar St
- 7 Black Duck Landing
- 30 Black Duck Landing
- 226 Cedar St
- 213 Cedar St
- 42 Black Duck Landing
- 330 Cedar St
- 335 Cedar St
- 35 Black Duck Landing
- 207 Cedar St
- 17 Cedar St
- 0 Cedar St L:17d Unit 73056096
- 0 Cedar St L:17d Unit 72813073
Your Personal Tour Guide
Ask me questions while you tour the home.