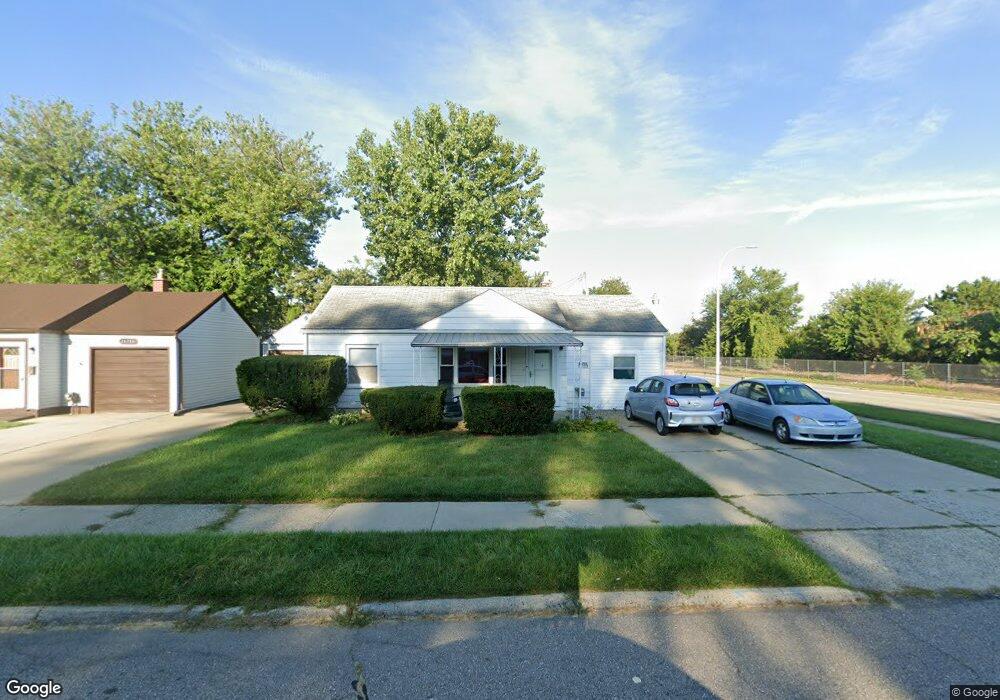
26761 Clancy St Roseville, MI 48066
Estimated Value: $106,242 - $155,000
2
Beds
1
Bath
672
Sq Ft
$207/Sq Ft
Est. Value
About This Home
This home is located at 26761 Clancy St, Roseville, MI 48066 and is currently estimated at $138,811, approximately $206 per square foot. 26761 Clancy St is a home located in Macomb County with nearby schools including Joseph G. Steenland Elementary School, Kaiser Elementary School, and Dort Elementary School.
Ownership History
Date
Name
Owned For
Owner Type
Purchase Details
Closed on
Nov 12, 2024
Sold by
Hess Stacey Marie
Bought by
Smith Jason
Current Estimated Value
Purchase Details
Closed on
Oct 11, 2024
Sold by
Mette Fredrick Matthew
Bought by
Hess Stacey Marie
Purchase Details
Closed on
Dec 14, 2015
Sold by
Kraft William R
Bought by
Mette Fred
Purchase Details
Closed on
Nov 1, 2011
Sold by
Cpi Housing Fund Llc
Bought by
Kraft William R
Purchase Details
Closed on
Aug 17, 2010
Sold by
Chase Home Finance Llc
Bought by
Federal National Mortgage Association
Purchase Details
Closed on
Aug 13, 2010
Sold by
Baker Caroline C
Bought by
Chase Home Finance Llc
Purchase Details
Closed on
Aug 31, 2000
Sold by
Annabelle Charles
Bought by
Mitchell Zebrowski
Home Financials for this Owner
Home Financials are based on the most recent Mortgage that was taken out on this home.
Original Mortgage
$79,500
Interest Rate
7.99%
Create a Home Valuation Report for This Property
The Home Valuation Report is an in-depth analysis detailing your home's value as well as a comparison with similar homes in the area
Home Values in the Area
Average Home Value in this Area
Purchase History
| Date | Buyer | Sale Price | Title Company |
|---|---|---|---|
| Smith Jason | $85,000 | Chirco Title | |
| Smith Jason | $85,000 | Chirco Title | |
| Hess Stacey Marie | -- | None Listed On Document | |
| Mette Fred | -- | None Available | |
| Kraft William R | $8,000 | None Available | |
| Federal National Mortgage Association | -- | None Available | |
| Chase Home Finance Llc | $74,082 | None Available | |
| Mitchell Zebrowski | $74,900 | -- |
Source: Public Records
Mortgage History
| Date | Status | Borrower | Loan Amount |
|---|---|---|---|
| Previous Owner | Mitchell Zebrowski | $79,500 |
Source: Public Records
Tax History
| Year | Tax Paid | Tax Assessment Tax Assessment Total Assessment is a certain percentage of the fair market value that is determined by local assessors to be the total taxable value of land and additions on the property. | Land | Improvement |
|---|---|---|---|---|
| 2025 | $2,456 | $60,500 | $0 | $0 |
| 2024 | $9 | $52,600 | $0 | $0 |
| 2023 | $823 | $45,700 | $0 | $0 |
| 2022 | $1,444 | $39,700 | $0 | $0 |
| 2021 | $1,402 | $35,400 | $0 | $0 |
| 2020 | $800 | $32,200 | $0 | $0 |
| 2019 | $1,230 | $26,500 | $0 | $0 |
| 2018 | $1,207 | $0 | $0 | $0 |
| 2017 | $1,126 | $22,008 | $7,238 | $14,770 |
| 2016 | $1,120 | $22,008 | $0 | $0 |
| 2015 | $826 | $18,720 | $0 | $0 |
| 2013 | -- | $19,407 | $0 | $0 |
| 2011 | -- | $23,672 | $0 | $0 |
Source: Public Records
Map
Nearby Homes
- 26751 Belanger St
- 26750 Belanger St
- 26511 Lehner St
- 26621 Kathy St
- 27247 Leroy St
- 26441 Belanger St
- 26431 Clancy St
- 26584 Kathy St
- 26629 Margaret St
- 26731 Grandmont St
- 27241 Woodmont St
- 26700 Grandmont St
- 26206 Dale Ct
- 26307 Woodmont St
- 27577 Larry St
- 26342 Grandmont St
- 26044 Lehner St
- 26730 Ridgemont St
- 26234 Woodmont St
- 26101 Compson St
- 26741 Clancy St
- 26760 Lehner St
- 26750 Lehner St
- 26740 Lehner St
- 26760 Clancy St
- 26731 Clancy St
- 26750 Clancy St
- 26740 Clancy St
- 26730 Lehner St
- 26721 Clancy St
- 26730 Clancy St
- 26761 Belanger St
- 26720 Clancy St
- 26711 Clancy St
- 26761 Lehner St
- 26741 Belanger St
- 26751 Lehner St
- 26741 Lehner St
- 26731 Belanger St
- 26710 Clancy St
Your Personal Tour Guide
Ask me questions while you tour the home.