2681 E Market St Warren, OH 44483
Harding NeighborhoodEstimated Value: $184,000 - $243,000
About This Home
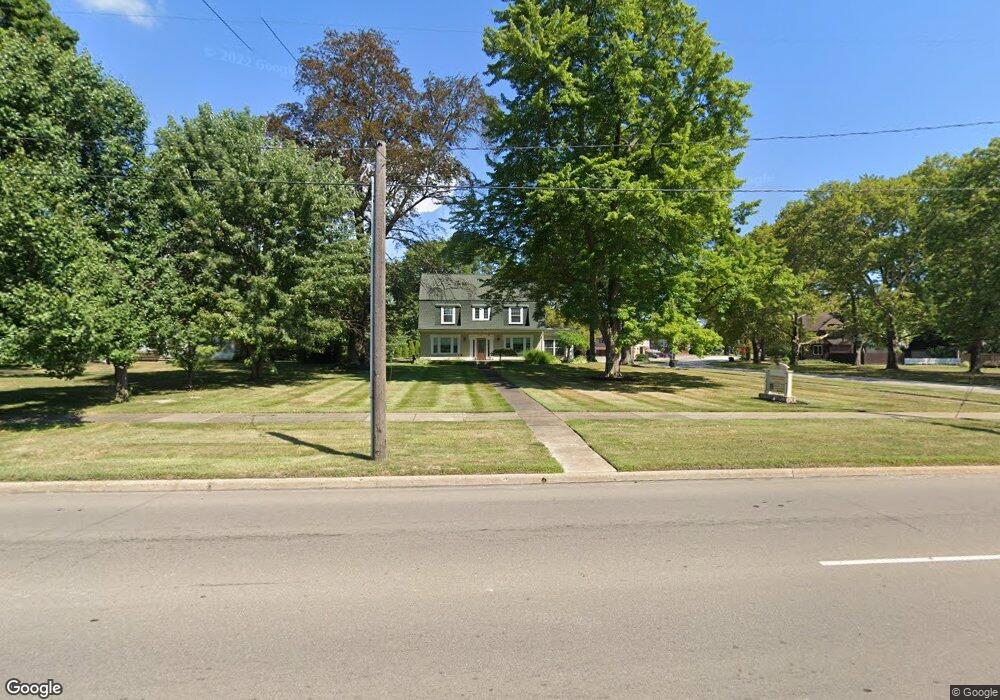
This home is located at 2681 E Market St, Warren, OH 44483 and is currently estimated at $206,333, approximately $81 per square foot. 2681 E Market St is a home located in Trumbull County with nearby schools including Lincoln PK-8 School, Warren G. Harding High School, and Summit Academy Community School - Warren.
Ownership History
We collect this data history from publicly available records. To have your information removed, we recommend requesting removal directly through your county’s website.
Purchase Details
Purchase Details
Purchase Details
Home Financials for this Owner
Home Financials are based on the most recent Mortgage that was taken out on this home.Purchase Details
Home Values in the Area
Average Home Value in this Area
Purchase History
We collect this data history from publicly available records. To have your information removed, we recommend requesting removal directly through your county’s website.
| Date | Buyer | Sale Price | Title Company |
|---|---|---|---|
| $890,300 | Fidelity National Title | ||
| $1,660,500 | -- | ||
| $130,000 | -- | ||
| -- | -- |
Mortgage History
We collect this data history from publicly available records. To have your information removed, we recommend requesting removal directly through your county’s website.
| Date | Status | Borrower | Loan Amount |
|---|---|---|---|
| Previous Owner | -- | ||
| Previous Owner | $777,600 | ||
| Previous Owner | $777,600 |
Tax History
We collect this data history from publicly available records. To have your information removed, we recommend requesting removal directly through your county’s website.
| Year | Tax Paid | Tax Assessment Tax Assessment Total Assessment is a certain percentage of the fair market value that is determined by local assessors to be the total taxable value of land and additions on the property. | Land | Improvement |
|---|---|---|---|---|
| 2025 | $2,746 | $53,210 | $9,420 | $43,790 |
| 2024 | $2,746 | $53,210 | $9,420 | $43,790 |
| 2023 | $2,694 | $53,210 | $9,420 | $43,790 |
| 2022 | $2,856 | $44,070 | $9,420 | $34,650 |
| 2021 | $2,861 | $44,070 | $9,420 | $34,650 |
| 2020 | $2,865 | $44,070 | $9,420 | $34,650 |
| 2019 | $2,764 | $40,360 | $9,420 | $30,940 |
| 2018 | $2,754 | $40,360 | $9,420 | $30,940 |
| 2017 | $2,711 | $40,360 | $9,420 | $30,940 |
| 2016 | $2,861 | $44,100 | $11,200 | $32,900 |
| 2015 | $2,843 | $44,100 | $11,200 | $32,900 |
| 2014 | $2,826 | $44,100 | $11,200 | $32,900 |
| 2013 | $2,880 | $47,360 | $11,200 | $36,160 |
Map
- 177 Willard Ave SE
- 420 Perkinswood Blvd NE
- 394 Meadowbrook Ave SE
- 199 Genesee Ave NE
- 314 Adelaide Ave SE
- 3240 E Market St
- 3210 Halsey Dr NE
- 365 Genesee Ave NE
- 629 Willard Ave SE
- 1820 E Market St
- 621 Kenmore Ave NE
- 556 Belvedere Ave SE
- 641 Fairway Dr NE
- 614 Meadowbrook Ave SE
- 197 Woodbine Ave SE
- 506 Adelaide Ave SE
- 405 Oak Knoll Ave SE
- 153 Royal Troon Dr SE
- 527 Oak Knoll Ave SE
- 419 Oak Knoll Ave NE
- 2659 E Market St
- 2645 E Market St
- 2800 Crescent Dr NE
- 189 Garfield Dr NE
- 2829 E Market St
- 2828 Crescent Dr NE
- 207 Garfield Dr NE
- 2625 E Market St
- 2845 E Market St
- 2816 E Market St
- 2852 Crescent Dr NE
- 225 Garfield Dr NE
- 2830 E Market St
- 146 Perkinswood Blvd SE
- 2861 E Market St
- 2551 E Market St
- 149 Perkinswood Blvd SE
- 158 Perkinswood Blvd SE
- 200 Garfield Dr NE Unit 1
- 200 Garfield Dr NE Unit 2
Ask me questions while you tour the home.