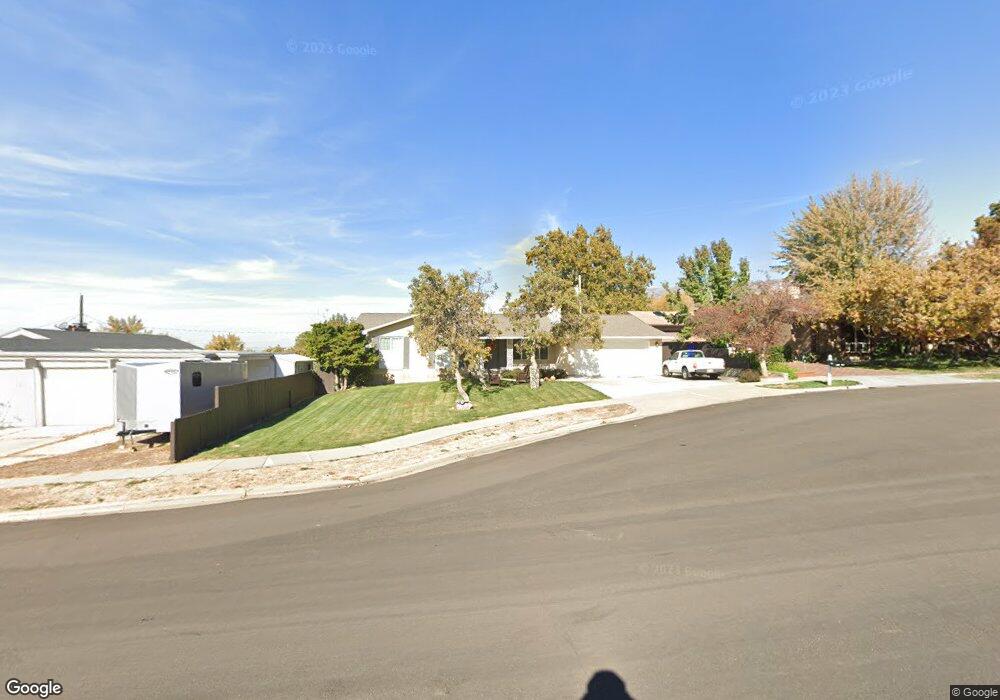
269 E 2050 S Bountiful, UT 84010
Estimated Value: $565,000 - $596,000
3
Beds
3
Baths
2,641
Sq Ft
$217/Sq Ft
Est. Value
About This Home
This home is located at 269 E 2050 S, Bountiful, UT 84010 and is currently estimated at $573,520, approximately $217 per square foot. 269 E 2050 S is a home located in Davis County with nearby schools including Muir School, Mueller Park Junior High School, and Bountiful High School.
Ownership History
Date
Name
Owned For
Owner Type
Purchase Details
Closed on
Feb 12, 2009
Sold by
Badger Kay L and Badger Carla B
Bought by
Badger Kay L and Badger Carla B
Current Estimated Value
Purchase Details
Closed on
May 26, 1999
Sold by
Hatch Donald M and Hatch Lucille A
Bought by
Badger Kay L and Badger Carla B
Home Financials for this Owner
Home Financials are based on the most recent Mortgage that was taken out on this home.
Original Mortgage
$110,500
Interest Rate
6.86%
Create a Home Valuation Report for This Property
The Home Valuation Report is an in-depth analysis detailing your home's value as well as a comparison with similar homes in the area
Purchase History
| Date | Buyer | Sale Price | Title Company |
|---|---|---|---|
| Badger Kay L | -- | None Available | |
| Badger Kay L | -- | Backman Stewart Title Servic |
Source: Public Records
Mortgage History
| Date | Status | Borrower | Loan Amount |
|---|---|---|---|
| Closed | Badger Kay L | $110,500 |
Source: Public Records
Tax History
| Year | Tax Paid | Tax Assessment Tax Assessment Total Assessment is a certain percentage of the fair market value that is determined by local assessors to be the total taxable value of land and additions on the property. | Land | Improvement |
|---|---|---|---|---|
| 2025 | $3,156 | $289,300 | $133,378 | $155,922 |
| 2024 | $2,948 | $279,951 | $117,574 | $162,377 |
| 2023 | $2,911 | $502,000 | $217,838 | $284,162 |
| 2022 | $3,042 | $288,200 | $119,364 | $168,836 |
| 2021 | $2,585 | $373,000 | $155,095 | $217,905 |
| 2020 | $2,280 | $330,000 | $133,012 | $196,988 |
| 2019 | $2,278 | $322,000 | $144,109 | $177,891 |
| 2018 | $2,149 | $299,000 | $139,430 | $159,570 |
| 2016 | $1,891 | $142,670 | $47,616 | $95,054 |
| 2015 | $1,852 | $131,945 | $47,616 | $84,329 |
| 2014 | $1,754 | $128,137 | $47,616 | $80,521 |
| 2013 | -- | $109,251 | $55,505 | $53,746 |
Source: Public Records
Map
Nearby Homes
- 296 E 2050 S Unit 2
- 2038 S 350 E Unit 3
- 2046 S 350 E Unit 4
- 295 E 2050 S Unit 1
- 2059 S 350 E Unit 6
- 2053 S 350 E Unit 7
- 320 E 2100 S
- 188 E 2050 S Unit D3
- 1886 S Jeri Dr
- 2273 S 200 E
- 2064 S Orchard Dr
- 2292 S 250 E
- 110 2250 S
- 2 E Wicker Ln
- 41 E 2200 S
- 141 E 1650 S
- 1820 S 50 W
- 631 E 1700 S
- 380 E 1500 S
- 1761 S Davis Blvd
- 281 E 2050 S
- 278 E 1950 S
- 294 E 1950 S
- 262 E 1950 S
- 318 E 1950 S
- 268 E 2050 S
- 254 E 1950 S
- 256 E 2050 S
- 280 E 2050 S
- 233 E 2050 S
- 336 E 1950 S
- 244 E 2050 S
- 242 E 1950 S
- 291 E 1950 S Unit 60
- 275 E 1950 S
- 295 E 2050 S Unit 37693124
- 295 E 2050 S Unit 37693093
- 295 E 2050 S Unit 37693071
- 295 E 2050 S Unit 37693036
- 295 E 2050 S Unit 37693002
Your Personal Tour Guide
Ask me questions while you tour the home.