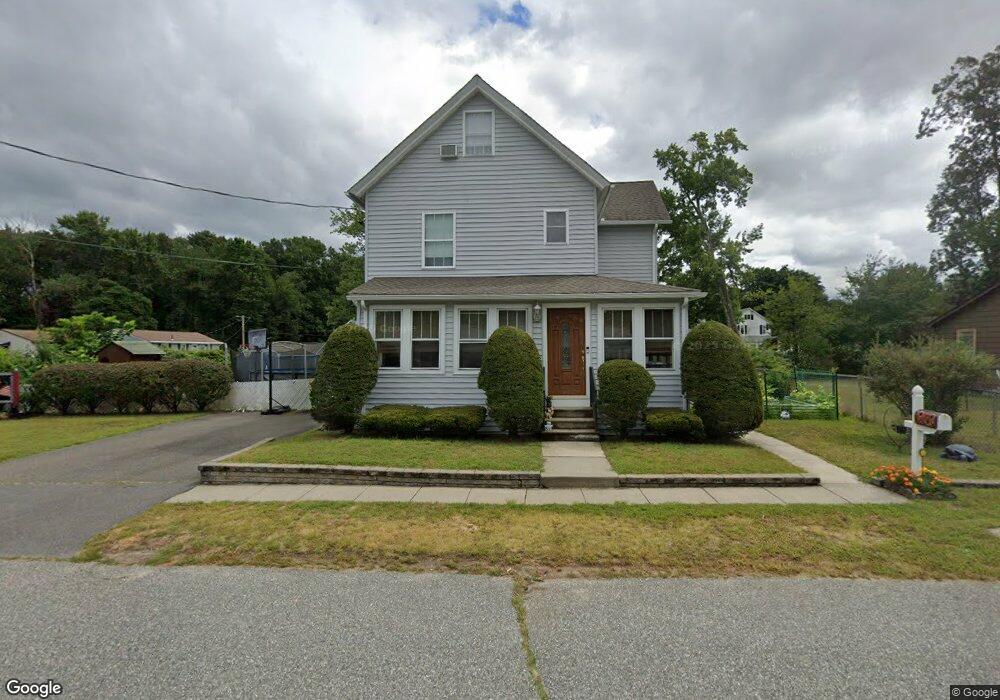
27 Ann St Chicopee, MA 01020
Fairview NeighborhoodEstimated Value: $360,000 - $480,000
3
Beds
1
Bath
1,984
Sq Ft
$205/Sq Ft
Est. Value
About This Home
This home is located at 27 Ann St, Chicopee, MA 01020 and is currently estimated at $406,581, approximately $204 per square foot. 27 Ann St is a home located in Hampden County with nearby schools including Bowie Elementary School, Fairview Middle School, and Chicopee Comprehensive High School.
Ownership History
Date
Name
Owned For
Owner Type
Purchase Details
Closed on
Jun 6, 2014
Sold by
Saletnik Dennis E and Saletnik Rhonda L
Bought by
Saletnik Dennis E and Saletnik Rhonda L
Current Estimated Value
Home Financials for this Owner
Home Financials are based on the most recent Mortgage that was taken out on this home.
Original Mortgage
$170,400
Outstanding Balance
$89,794
Interest Rate
4.33%
Mortgage Type
New Conventional
Estimated Equity
$316,787
Purchase Details
Closed on
Jul 18, 1996
Sold by
Lacaresse Donald B and Sweetman Sharon D
Bought by
Saletnik Dennis E
Purchase Details
Closed on
Jul 2, 1987
Sold by
Depelteau Raymond
Bought by
Lacaresse Donald B
Create a Home Valuation Report for This Property
The Home Valuation Report is an in-depth analysis detailing your home's value as well as a comparison with similar homes in the area
Home Values in the Area
Average Home Value in this Area
Purchase History
| Date | Buyer | Sale Price | Title Company |
|---|---|---|---|
| Saletnik Dennis E | -- | -- | |
| Saletnik Dennis E | $79,000 | -- | |
| Lacaresse Donald B | $98,000 | -- |
Source: Public Records
Mortgage History
| Date | Status | Borrower | Loan Amount |
|---|---|---|---|
| Open | Saletnik Dennis E | $170,400 | |
| Previous Owner | Lacaresse Donald B | $32,000 | |
| Previous Owner | Lacaresse Donald B | $138,800 | |
| Previous Owner | Lacaresse Donald B | $115,000 |
Source: Public Records
Tax History
| Year | Tax Paid | Tax Assessment Tax Assessment Total Assessment is a certain percentage of the fair market value that is determined by local assessors to be the total taxable value of land and additions on the property. | Land | Improvement |
|---|---|---|---|---|
| 2025 | $4,939 | $325,800 | $110,800 | $215,000 |
| 2024 | $4,680 | $317,100 | $108,600 | $208,500 |
| 2023 | $4,386 | $289,500 | $98,700 | $190,800 |
| 2022 | $4,181 | $246,100 | $85,800 | $160,300 |
| 2021 | $3,941 | $223,800 | $78,000 | $145,800 |
| 2020 | $3,777 | $216,300 | $80,100 | $136,200 |
| 2019 | $3,711 | $206,600 | $80,100 | $126,500 |
| 2018 | $3,565 | $194,700 | $76,300 | $118,400 |
| 2017 | $3,346 | $193,300 | $70,000 | $123,300 |
| 2016 | $3,275 | $193,700 | $70,000 | $123,700 |
| 2015 | $3,482 | $198,500 | $70,000 | $128,500 |
| 2014 | $1,741 | $198,500 | $70,000 | $128,500 |
Source: Public Records
Map
Nearby Homes
- 71 Ann St
- 128 Ann St
- 54 Yorktown Ct
- 2085 Memorial Dr
- 90 Anson St
- 15 Hudson Ave
- 48 Beeler Ave
- 56 Old Lyman Rd
- 47 Boucher Cir
- 1709 Memorial Dr
- 20 Lyman Terrace
- 240 Mccarthy Ave
- 81 Mccarthy Ave
- 22 Harrington Rd
- 25 Shadow Brook Estates Unit 25
- 523 James St
- 0 Granby Rd
- 35 Ludlow Rd
- 20 Hillside Ave
- 84 Montcalm St
Your Personal Tour Guide
Ask me questions while you tour the home.