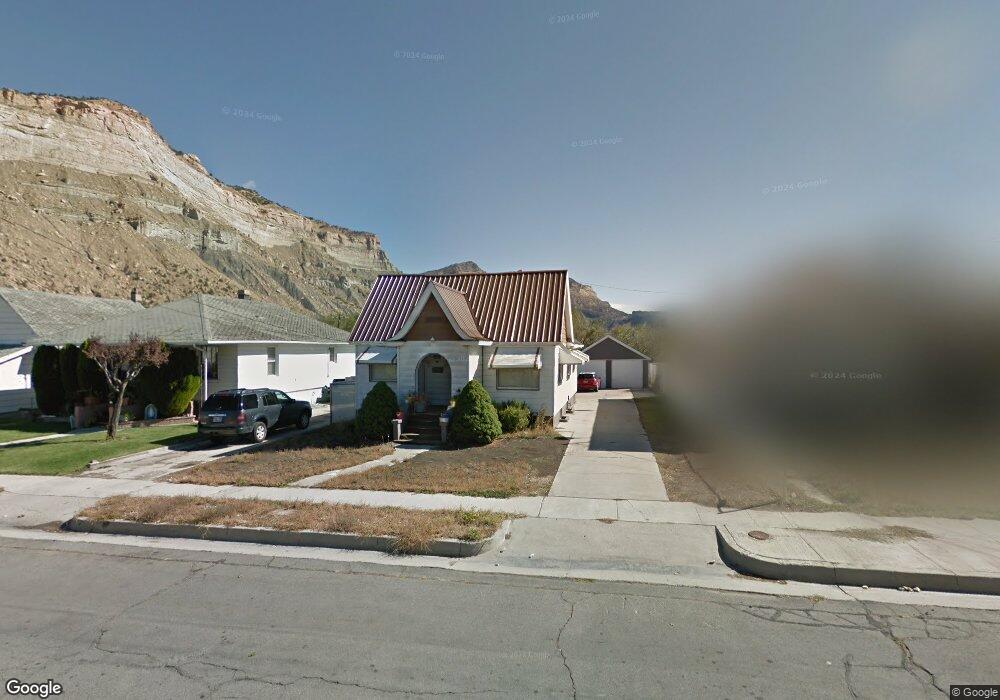
27 Bryner St Helper, UT 84526
Estimated Value: $257,000
3
Beds
1
Bath
2,019
Sq Ft
$127/Sq Ft
Est. Value
About This Home
This home is located at 27 Bryner St, Helper, UT 84526 and is currently estimated at $257,000, approximately $127 per square foot. 27 Bryner St is a home located in Carbon County with nearby schools including Sally Mauro School, Helper Middle School, and Carbon High School.
Ownership History
Date
Name
Owned For
Owner Type
Purchase Details
Closed on
Feb 25, 2020
Sold by
Chenworth Alan J and Chenworth Tonya L
Bought by
27 Bryner Street Llc
Current Estimated Value
Purchase Details
Closed on
Jun 29, 2019
Sold by
Chenworth Alan J and Chenworth Tonya L
Bought by
27 Bryner Street Llc
Purchase Details
Closed on
Aug 1, 2006
Sold by
Hanna Trent B
Bought by
Koon Colleen P
Home Financials for this Owner
Home Financials are based on the most recent Mortgage that was taken out on this home.
Original Mortgage
$80,000
Interest Rate
10.25%
Mortgage Type
Assumption
Create a Home Valuation Report for This Property
The Home Valuation Report is an in-depth analysis detailing your home's value as well as a comparison with similar homes in the area
Home Values in the Area
Average Home Value in this Area
Purchase History
| Date | Buyer | Sale Price | Title Company |
|---|---|---|---|
| 27 Bryner Street Llc | -- | None Available | |
| 27 Bryner Street Llc | -- | None Available | |
| Koon Colleen P | -- | South Eastern Utah Title Co |
Source: Public Records
Mortgage History
| Date | Status | Borrower | Loan Amount |
|---|---|---|---|
| Previous Owner | Koon Colleen P | $80,000 |
Source: Public Records
Tax History
| Year | Tax Paid | Tax Assessment Tax Assessment Total Assessment is a certain percentage of the fair market value that is determined by local assessors to be the total taxable value of land and additions on the property. | Land | Improvement |
|---|---|---|---|---|
| 2025 | $637 | $90,579 | $25,740 | $64,839 |
| 2024 | $1,132 | $166,666 | $27,222 | $139,444 |
| 2023 | $765 | $117,950 | $31,245 | $86,705 |
| 2022 | $665 | $90,208 | $21,666 | $68,542 |
| 2021 | $581 | $67,944 | $15,300 | $52,644 |
| 2020 | $561 | $32,934 | $0 | $0 |
| 2019 | $599 | $36,300 | $0 | $0 |
| 2018 | $582 | $36,300 | $0 | $0 |
| 2017 | $575 | $36,300 | $0 | $0 |
| 2016 | $528 | $36,300 | $0 | $0 |
| 2015 | $528 | $36,300 | $0 | $0 |
| 2014 | $661 | $45,654 | $0 | $0 |
| 2013 | $663 | $45,654 | $0 | $0 |
Source: Public Records
Map
Nearby Homes
Your Personal Tour Guide
Ask me questions while you tour the home.