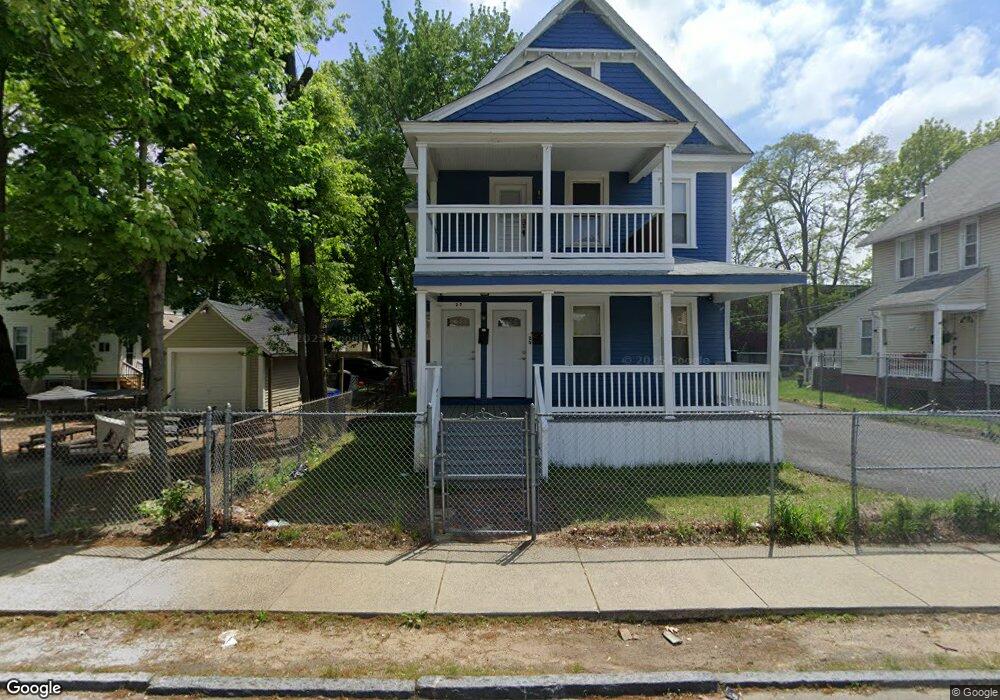
27 Burr St Springfield, MA 01109
Bay NeighborhoodEstimated Value: $284,831 - $371,000
About This Home
This home is located at 27 Burr St, Springfield, MA 01109 and is currently estimated at $329,958, approximately $107 per square foot. 27 Burr St is a home located in Hampden County with nearby schools including Rebecca M Johnson School, John F. Kennedy Academy, and Springfield High School of Science and Technology.
Ownership History
We collect this data history from publicly available records. To have your information removed, we recommend requesting removal directly through your county’s website.
Purchase Details
Purchase Details
Purchase Details
Home Financials for this Owner
Home Financials are based on the most recent Mortgage that was taken out on this home.Purchase Details
Home Values in the Area
Average Home Value in this Area
Purchase History
We collect this data history from publicly available records. To have your information removed, we recommend requesting removal directly through your county’s website.
| Date | Buyer | Sale Price | Title Company |
|---|---|---|---|
| $189,000 | -- | ||
| $138,000 | -- | ||
| $45,000 | -- | ||
| $18,000 | -- |
Mortgage History
We collect this data history from publicly available records. To have your information removed, we recommend requesting removal directly through your county’s website.
| Date | Status | Borrower | Loan Amount |
|---|---|---|---|
| Open | $148,500 | ||
| Closed | $147,050 | ||
| Previous Owner | $56,000 | ||
| Previous Owner | $45,000 |
Tax History
We collect this data history from publicly available records. To have your information removed, we recommend requesting removal directly through your county’s website.
| Year | Tax Paid | Tax Assessment Tax Assessment Total Assessment is a certain percentage of the fair market value that is determined by local assessors to be the total taxable value of land and additions on the property. | Land | Improvement |
|---|---|---|---|---|
| 2025 | $3,167 | $202,000 | $31,100 | $170,900 |
| 2024 | $3,177 | $197,800 | $31,100 | $166,700 |
| 2023 | $2,614 | $153,300 | $28,300 | $125,000 |
| 2022 | $3,277 | $174,100 | $26,500 | $147,600 |
| 2021 | $2,782 | $147,200 | $24,000 | $123,200 |
| 2020 | $2,642 | $135,300 | $24,000 | $111,300 |
| 2019 | $2,383 | $121,100 | $24,000 | $97,100 |
| 2018 | $2,092 | $106,300 | $24,000 | $82,300 |
| 2017 | $2,186 | $111,200 | $24,000 | $87,200 |
| 2016 | $2,163 | $110,000 | $24,000 | $86,000 |
| 2015 | -- | $110,000 | $24,000 | $86,000 |
Map
- 85 Montrose St
- 90 Andrew St
- 65 Montrose St
- 102-104 Cambridge St
- 49 Andrew St
- 46 Mapledell St
- 62 Kenyon St
- 25 Dawes St
- 136 Maynard St
- 158 Bowles St
- 49 Maynard St
- 50-52 Sycamore St
- 43 Princeton St
- 86 Amherst St
- 205 St James Ave
- 115-117 Northampton Ave
- 127 Thompson St
- 64 Thompson St
- 288 Saint James Ave
- 658 Union St
- 18 Burr St
- 154 Cambridge St
- 21 Burr St
- 96 Montrose St
- 99 Andrew St
- 142 Cambridge St
- 146 Cambridge St
- 15 Burr St
- 111 Andrew St Unit 113
- 136 Cambridge St Unit 138
- 90 Montrose St
- 117 Dawes St
- 91 Andrew St
- 134 Cambridge St
- 119 Andrew St
- 86 Montrose St
- 113 Dawes St
- 46 Burr St Unit 48
- 123 - 125 Andrew St
- 46-48 Burr St
Ask me questions while you tour the home.