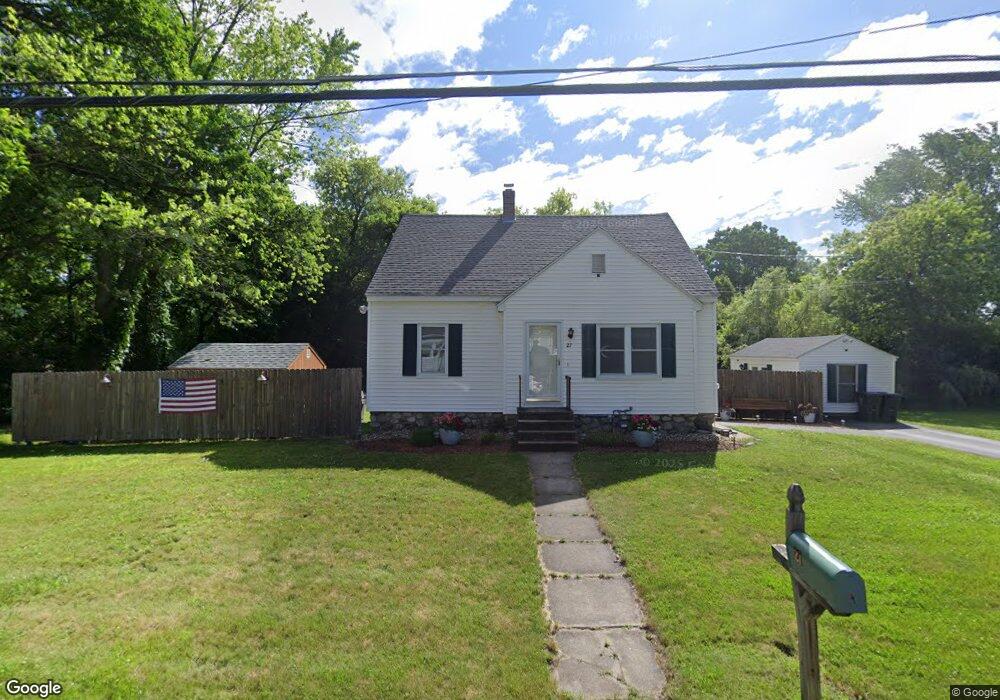
27 Chapman St Dracut, MA 01826
Estimated Value: $537,663 - $638,000
3
Beds
3
Baths
1,486
Sq Ft
$397/Sq Ft
Est. Value
About This Home
This home is located at 27 Chapman St, Dracut, MA 01826 and is currently estimated at $590,416, approximately $397 per square foot. 27 Chapman St is a home located in Middlesex County with nearby schools including Greenmont Avenue School, Richardson Middle School, and Dracut Senior High School.
Ownership History
Date
Name
Owned For
Owner Type
Purchase Details
Closed on
Mar 11, 1987
Sold by
Bewll Thomas J
Bought by
Dunleavy Joseph P
Current Estimated Value
Home Financials for this Owner
Home Financials are based on the most recent Mortgage that was taken out on this home.
Original Mortgage
$85,000
Interest Rate
9.01%
Mortgage Type
Purchase Money Mortgage
Create a Home Valuation Report for This Property
The Home Valuation Report is an in-depth analysis detailing your home's value as well as a comparison with similar homes in the area
Home Values in the Area
Average Home Value in this Area
Purchase History
| Date | Buyer | Sale Price | Title Company |
|---|---|---|---|
| Dunleavy Joseph P | $150,000 | -- |
Source: Public Records
Mortgage History
| Date | Status | Borrower | Loan Amount |
|---|---|---|---|
| Open | Dunleavy Joseph P | $61,000 | |
| Closed | Dunleavy Joseph P | $85,000 |
Source: Public Records
Tax History
| Year | Tax Paid | Tax Assessment Tax Assessment Total Assessment is a certain percentage of the fair market value that is determined by local assessors to be the total taxable value of land and additions on the property. | Land | Improvement |
|---|---|---|---|---|
| 2025 | $5,047 | $498,700 | $205,000 | $293,700 |
| 2024 | $4,834 | $462,600 | $195,300 | $267,300 |
| 2023 | $4,671 | $403,400 | $169,800 | $233,600 |
| 2022 | $4,556 | $370,700 | $154,300 | $216,400 |
| 2021 | $4,419 | $339,700 | $140,200 | $199,500 |
| 2020 | $4,287 | $321,100 | $136,000 | $185,100 |
| 2019 | $4,268 | $310,400 | $129,500 | $180,900 |
| 2018 | $4,031 | $285,100 | $129,500 | $155,600 |
| 2017 | $3,806 | $285,100 | $129,500 | $155,600 |
| 2016 | $3,691 | $248,700 | $124,500 | $124,200 |
| 2015 | $3,619 | $242,400 | $124,500 | $117,900 |
| 2014 | $3,438 | $237,300 | $124,500 | $112,800 |
Source: Public Records
Map
Nearby Homes
- 173 Greenmont Ave
- 54 Montaup Ave
- 17 Roland Ave
- 112 Genest St Unit 9
- 551 Hildreth St Unit 21
- 9 Superior Ave
- 10 Lanseigne St
- 50 Frank St Unit 50
- 1 19th St Unit 3
- 361 Hildreth St Unit 24
- 23 18th St
- 315 Broadway Rd Unit 1
- 4 Hazelwood Ave Unit 12
- 15 Dana St
- 23 Carle Dr
- 103 Dalton St
- 337 Beacon St
- Lot 11 Christian St
- Lot 12 Christian St
- Lot 9 Christian St
- 19 Chapman St Unit 2nd Floor
- 19 Chapman St
- 46 Champlain St
- 24 Chapman St
- 30 Chapman St
- 44 Champlain St
- 37 Chapman St
- 18 Chapman St
- 36 Chapman St
- 24 Lafayette St
- 51 Champlain St
- 36 Lafayette St
- 59 Champlain St
- 53 Champlain St
- 46 Lafayette St
- 47 Chapman St
- 1441 Bridge St
- 1411 Bridge St
- 1421 Bridge St
- 20 Lafayette St
Your Personal Tour Guide
Ask me questions while you tour the home.